The D-Day Principle
Why One Signal Is Never Enough
Before the Allied landings in Normandy in 1944, the greatest risk was not German firepower. It was uncertainty.

General Dwight D. Eisenhower did not face a single decision variable. He faced dozens — many of them conflicting. Weather forecasts were unreliable. Intelligence reports were incomplete. Tide tables mattered. Moonlight mattered. Enemy positioning mattered. Logistics, morale, deception, timing.
Every single input could be wrong. And crucially: every invasion would be different. There was no historical template saying: "If wind speed is X, attack."
The Allies did not look for certainty. They looked for confluence. They evaluated multiple weather models — most of them disagreeing — alongside naval and air conditions, reconnaissance reports, enemy behavior patterns, logistical readiness, and the cost of delay versus action.
Each signal alone was insufficient. Together, they formed a probabilistic judgment. That judgment did not say: "Success is guaranteed." It said: "This is the least bad window we will get."
Every market cycle, like every invasion, is unique. The macro backdrop changes. The policy regime changes. Market structure evolves. Participants rotate. Liquidity dynamics shift. Relying on a single metric — valuation, volatility, breadth, momentum, macro data — assumes a stability that simply does not exist.
Just as no two military campaigns are identical, no two market regimes repeat cleanly. "This time is different" is not arrogance. It is a statement of reality.
Complex systems cannot be navigated with single-point indicators. A weather forecast alone was useless. Intelligence alone was useless. Timing alone was useless. Only the aggregation of imperfect signals created actionable insight.
Markets work the same way. A composite indicator does not ask whether volatility is high, or breadth is strong, or credit spreads are tight, or momentum is positive. It asks: What do all of these observations say together? Are risks reinforcing or offsetting each other? Is the system becoming fragile or resilient?
The most dangerous moments are not when indicators scream panic. They are when individual signals look benign, but the overall configuration is unstable. Before D-Day, conditions were not "good." They were good enough across many dimensions at once.
The Core Insight
The Smart Money Tracker is not designed to predict exact outcomes. It is designed to answer a better question: Given everything we observe right now, is the system becoming safer — or more fragile?
"In complex systems, judgment does not come from one signal being right, but from many imperfect signals pointing in the same direction."
Historical Examples
See how the Smart Money Tracker performed during major market events
Corona Crash 2020
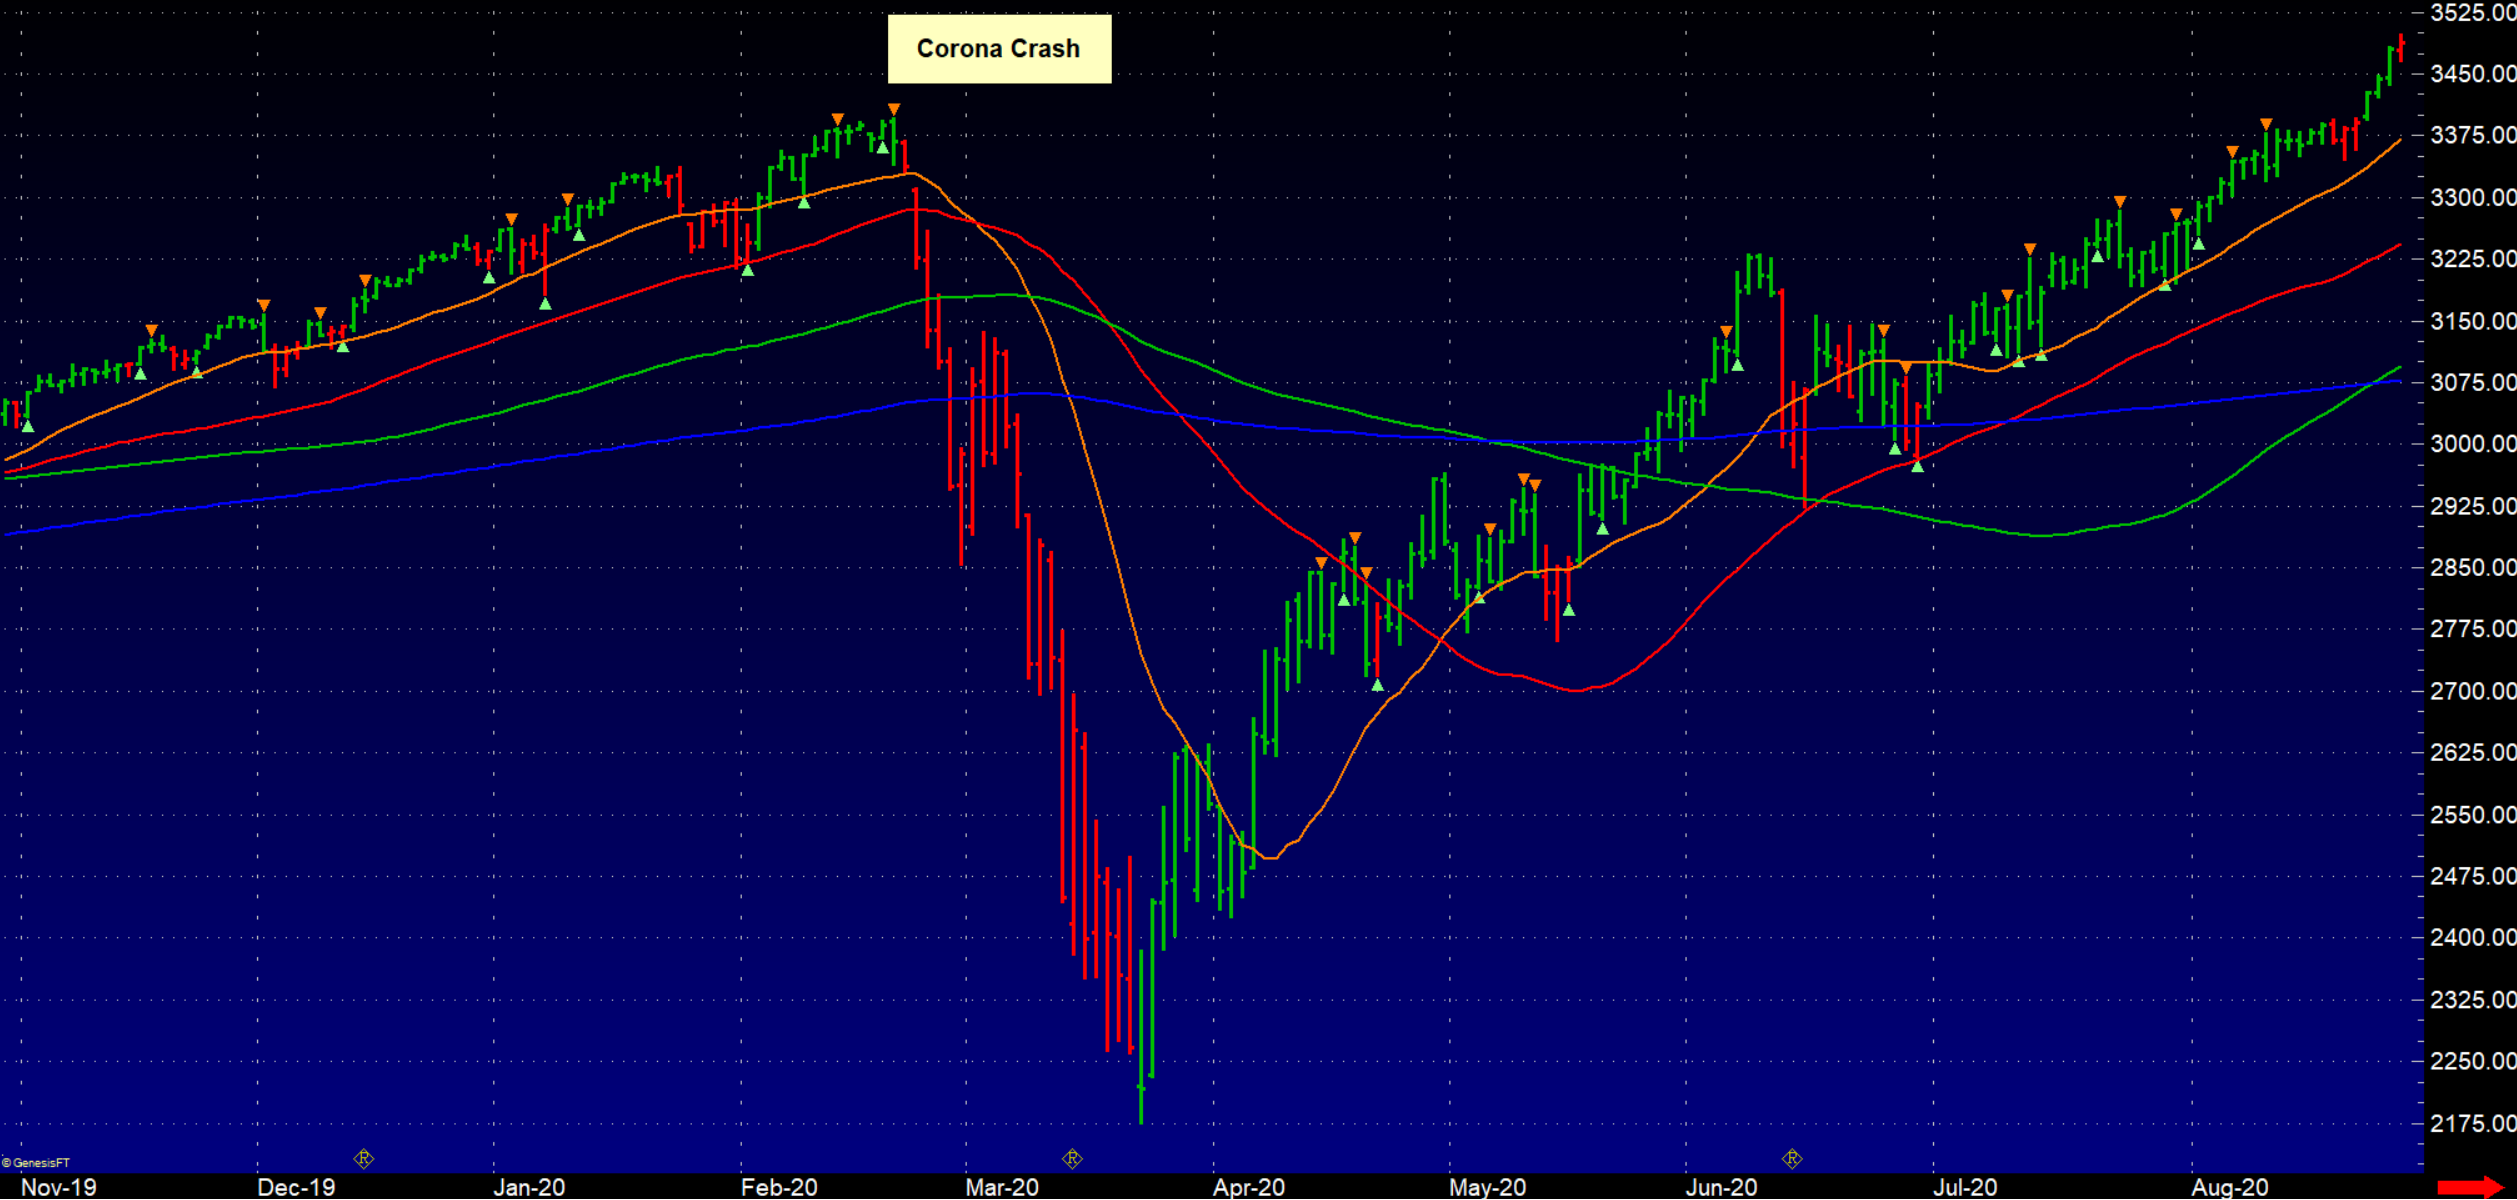
The market remained strong until February 20, 2020, when the Smart Money Tracker signaled a bearish impulse. This was immediately followed by the first red daily candle. Traders who acted on this signal could have exited the market with minimal losses before the major sell-off began. On April 23, the first green signal appeared — buying at the absolute bottom and participating in one of the strongest rallies in market history.
Fitch Downgrade August 2023
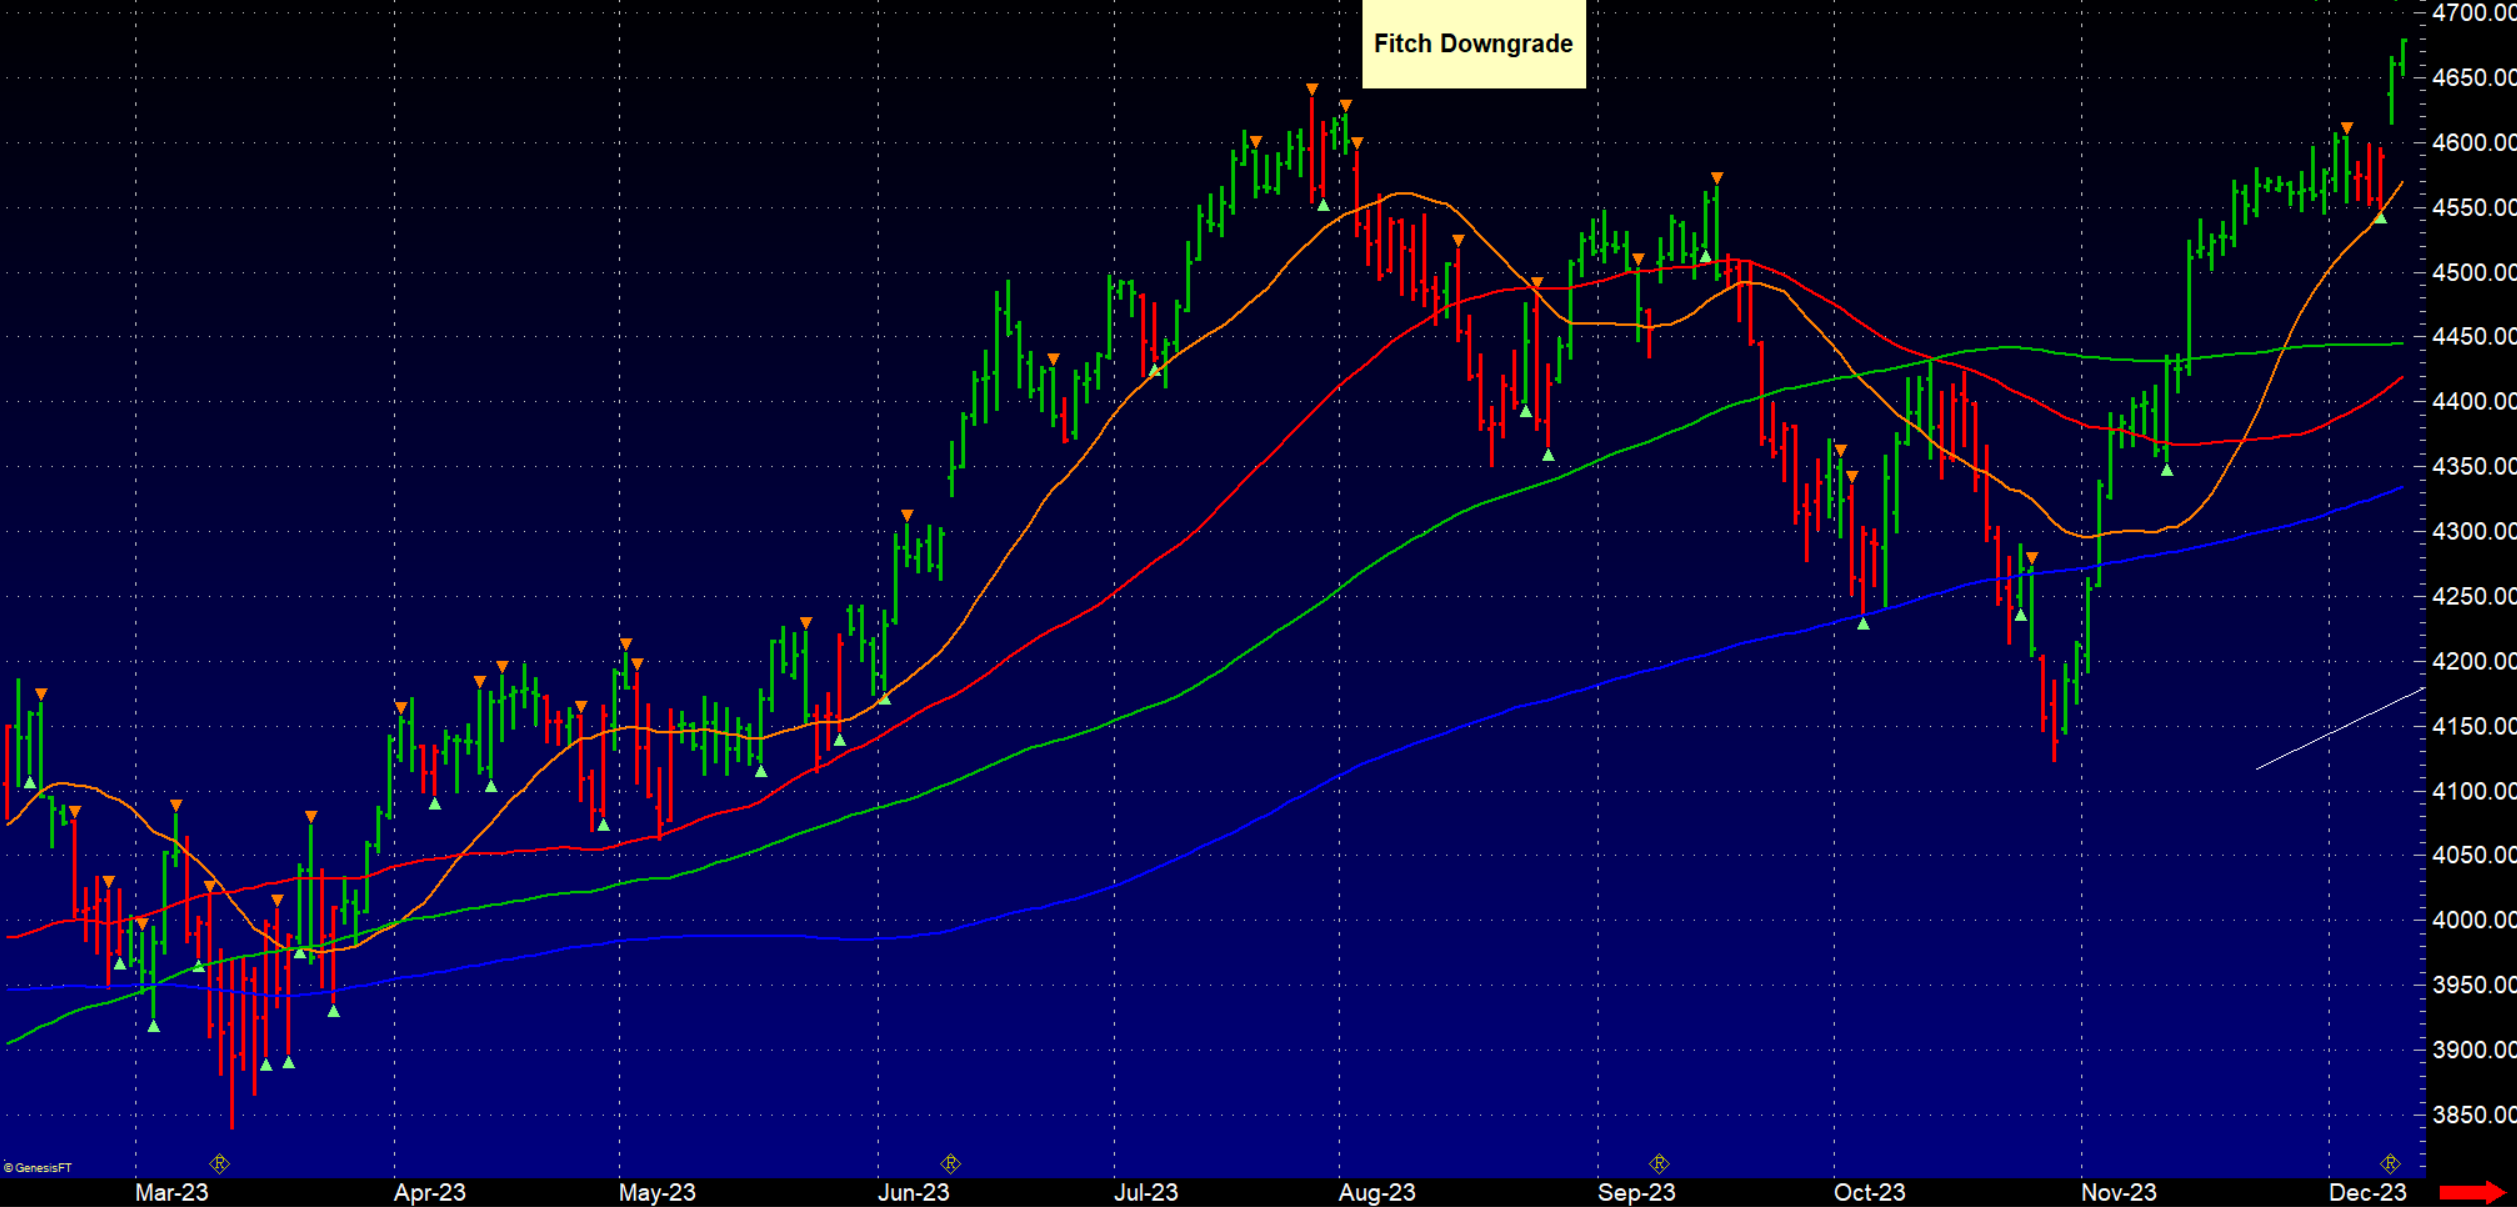
The market began topping out several days before the Fitch downgrade was officially announced. The Smart Money Tracker turned red, registering multiple consecutive bearish impulses — a clear warning signal well before Fitch made its public statement. The market then moved lower in three distinct waves, with the Indicator reliably signaling key highs and lows throughout the decline.
Fed Peak Rates November 2023
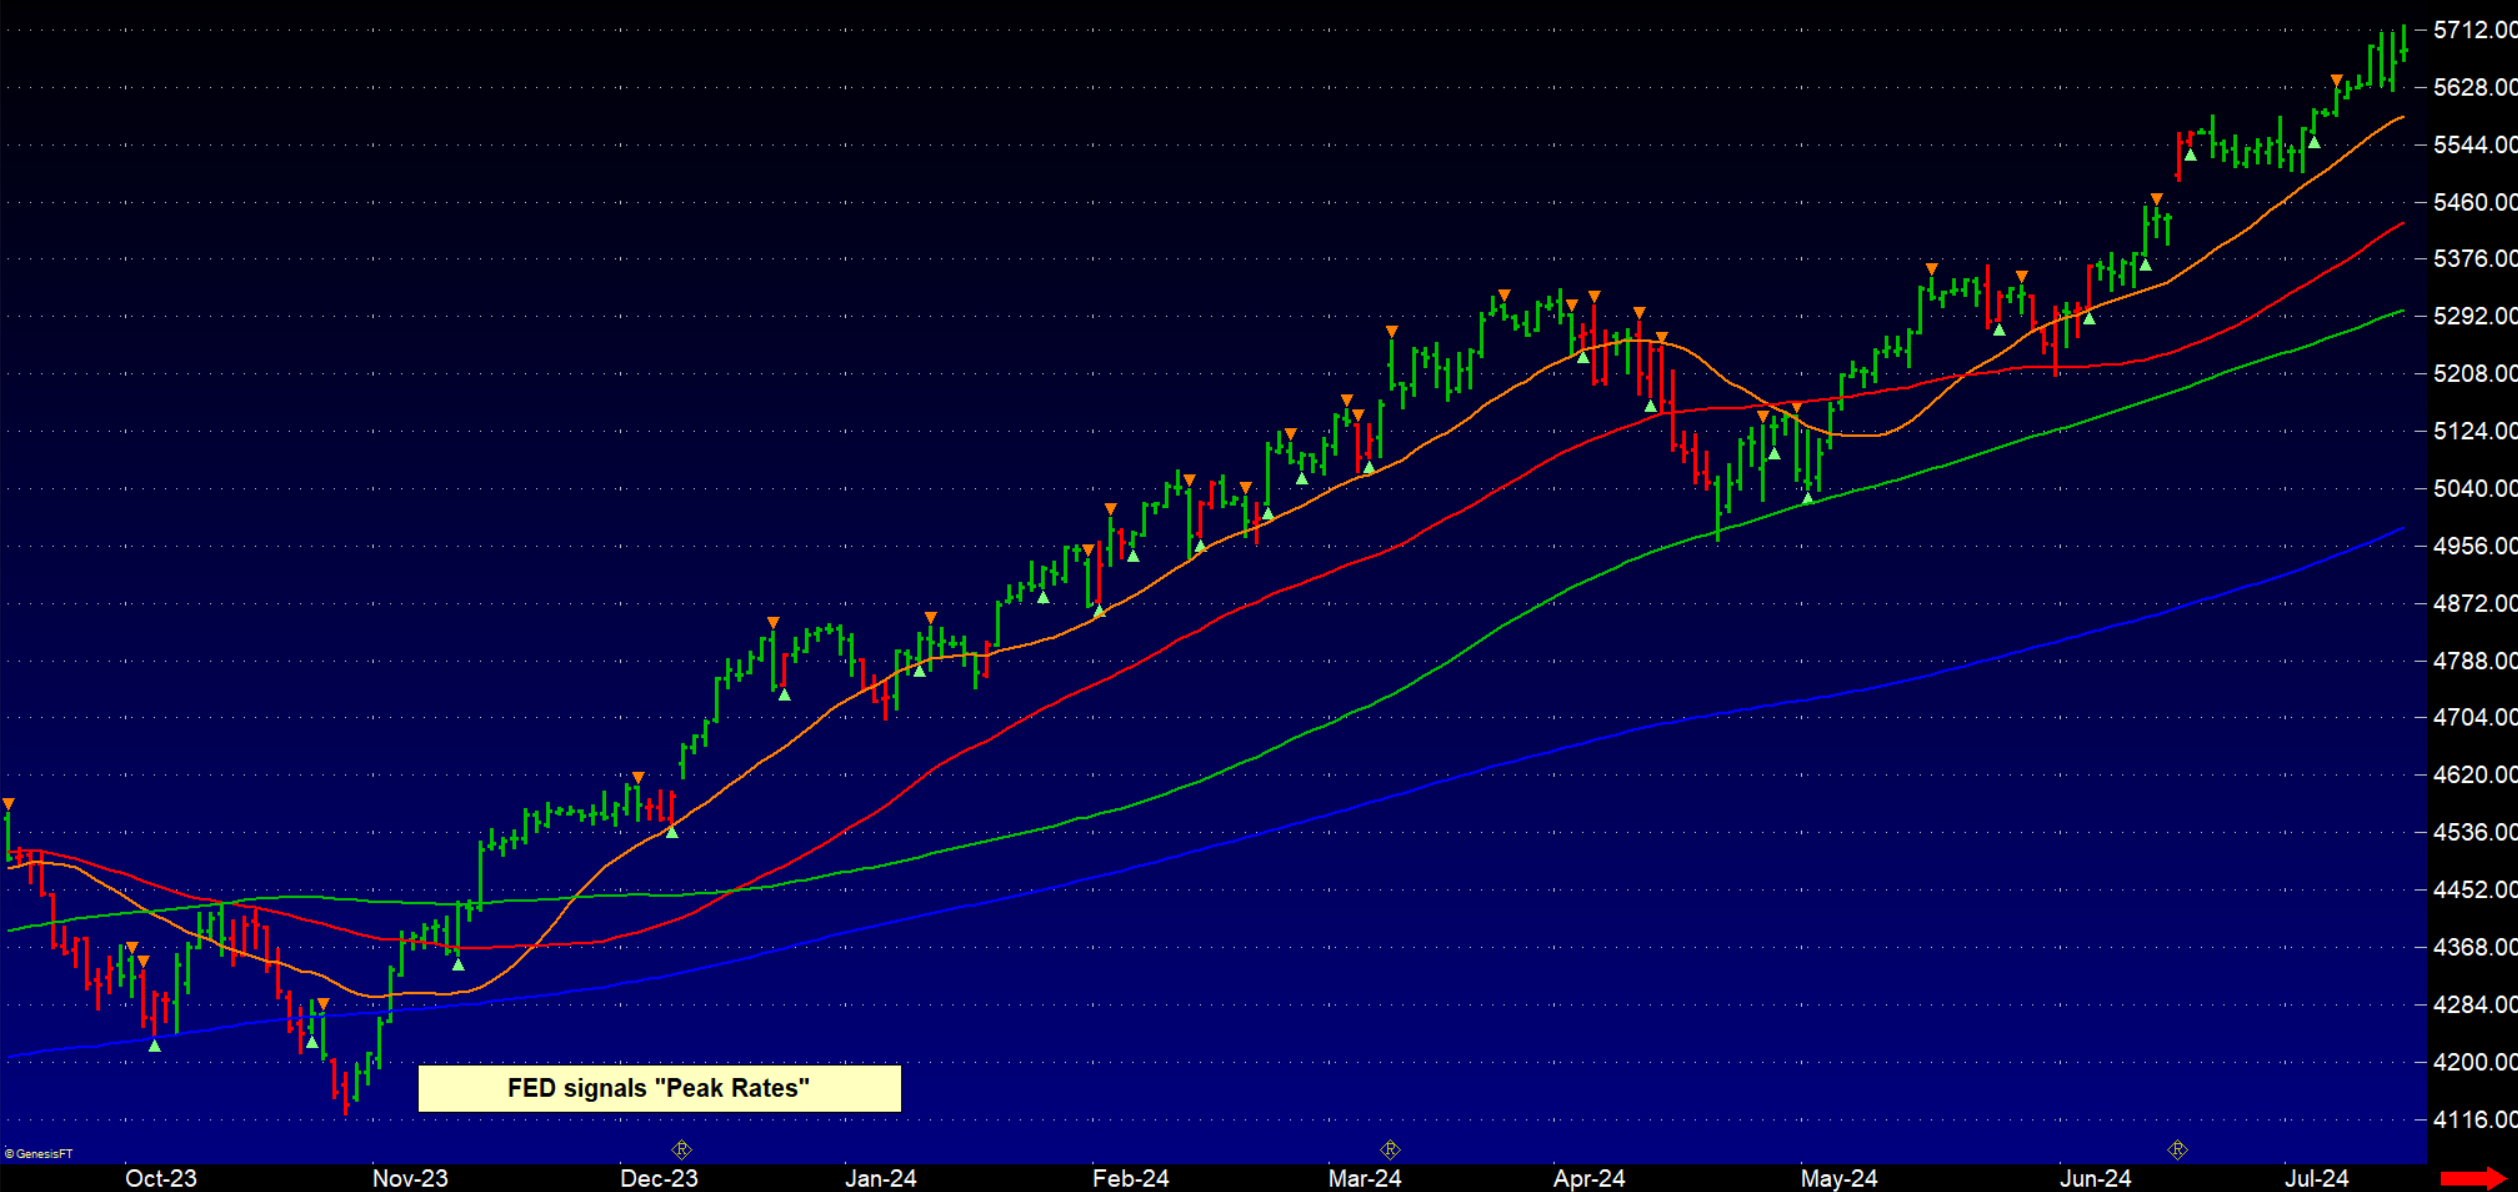
The absolute market bottom was reached in November 2023, coinciding with the realization that the Federal Reserve was pausing its rate hikes. This led to a shift in the Smart Money Tracker to green. The bullish impulse occurred on November 10, after which the market continued its upward trajectory, rallying strongly through March 2024.
Trump's Reciprocal Tariffs February 2025
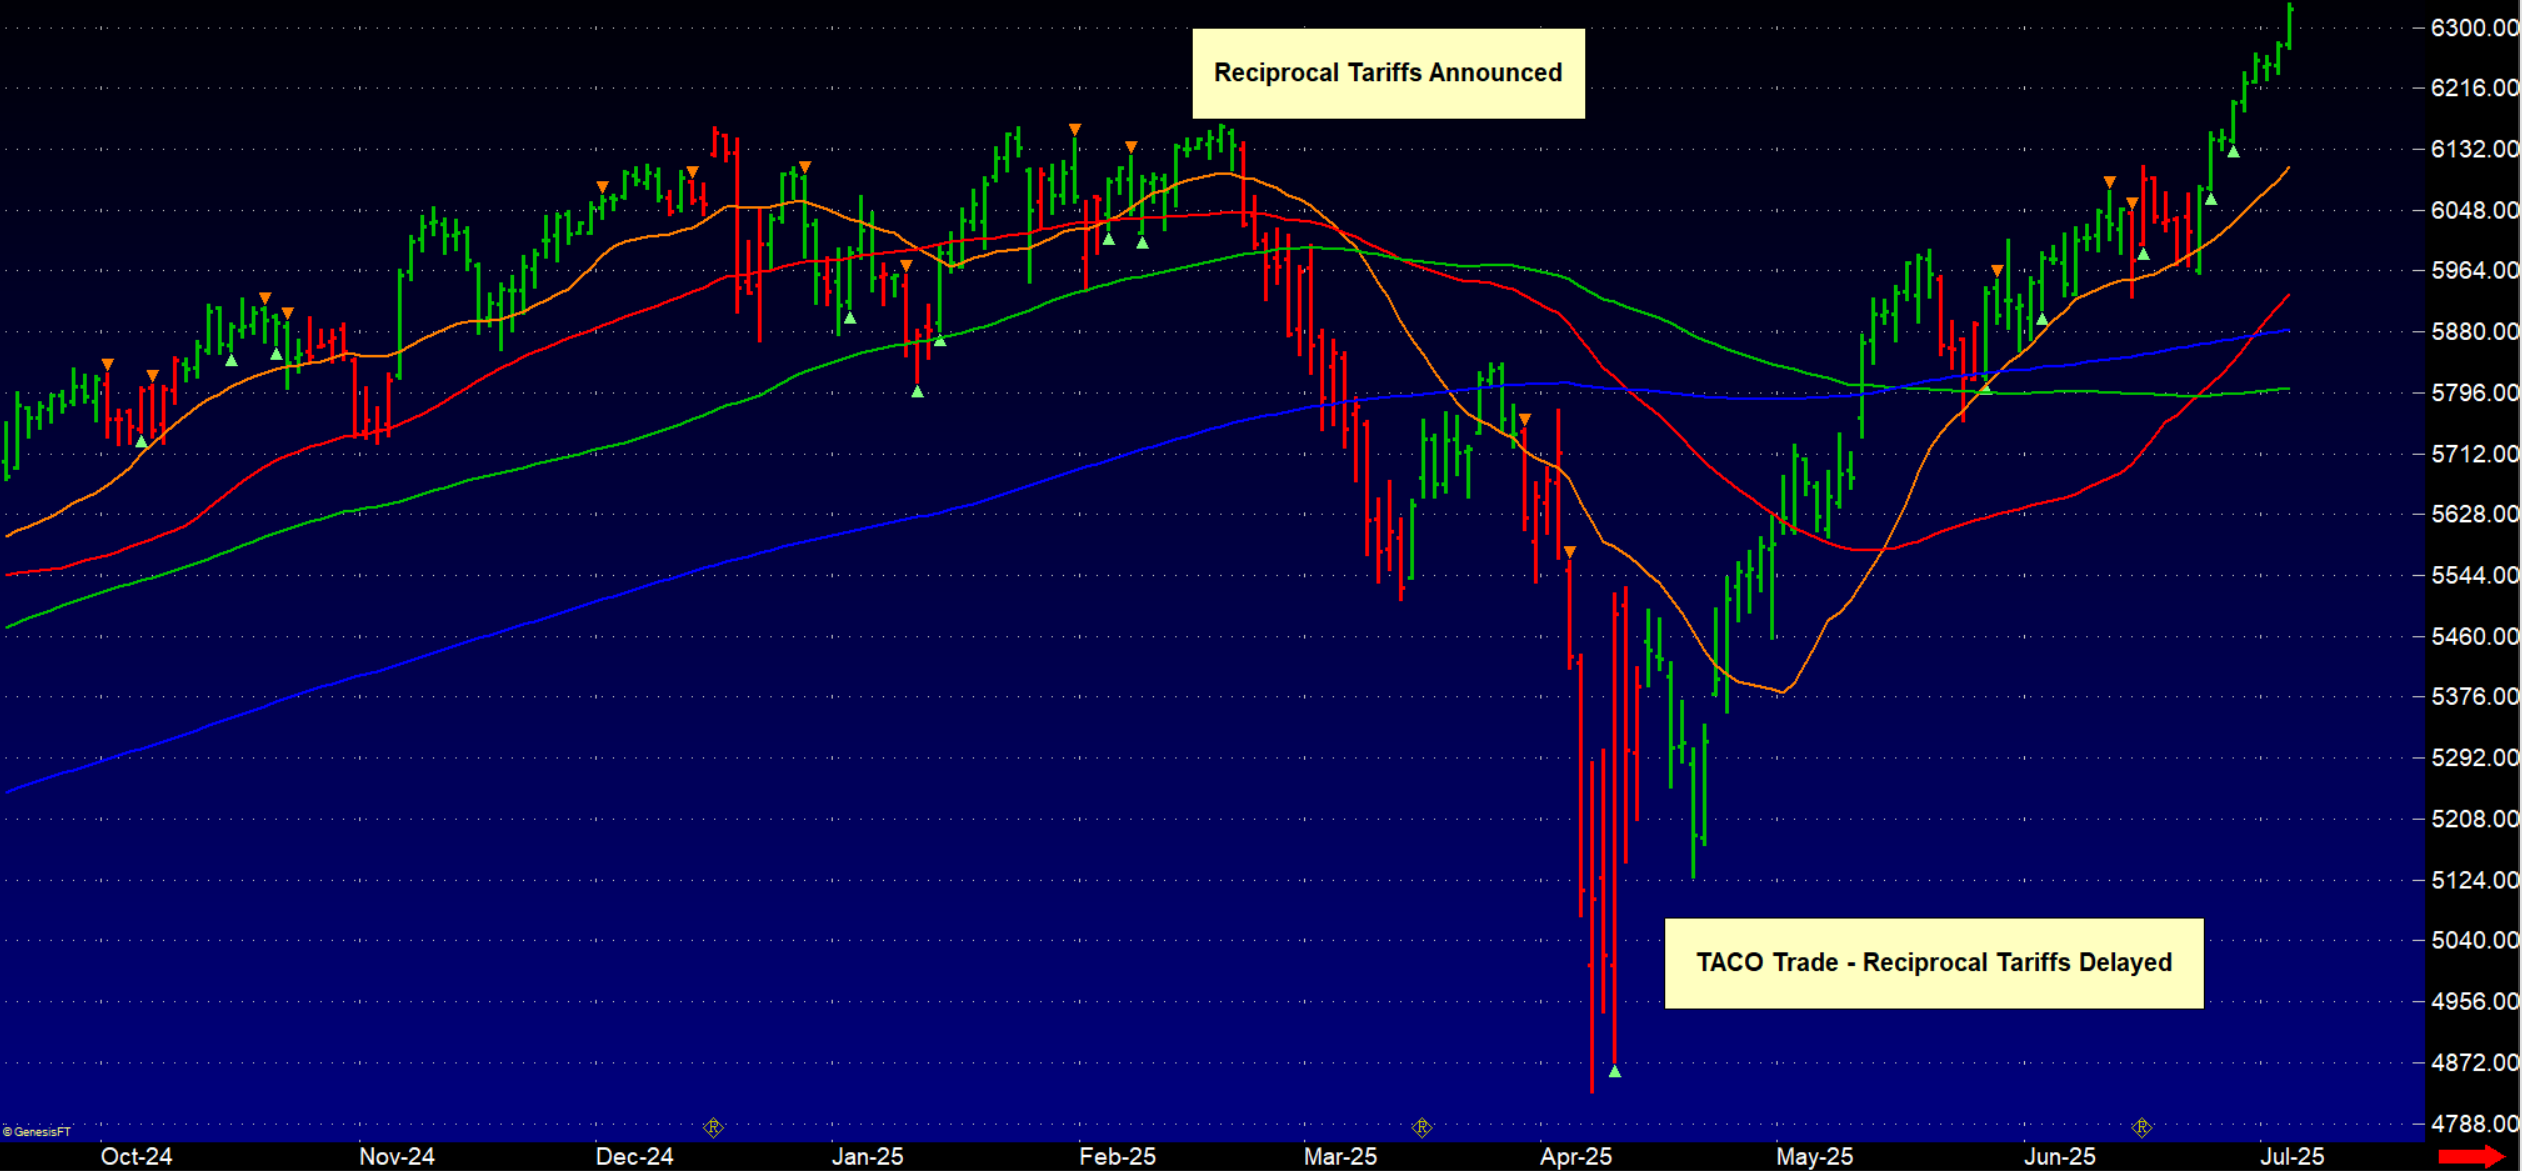
A significant market sell-off was triggered by President Trump's announcement of reciprocal tariffs. At the low in April, an unexpected announcement postponed implementation by 90 days. The Smart Money Tracker detected a three-day period of accumulation before a major rally commenced, culminating in a strong V-shaped recovery.
Weekly Overview 2020–2025
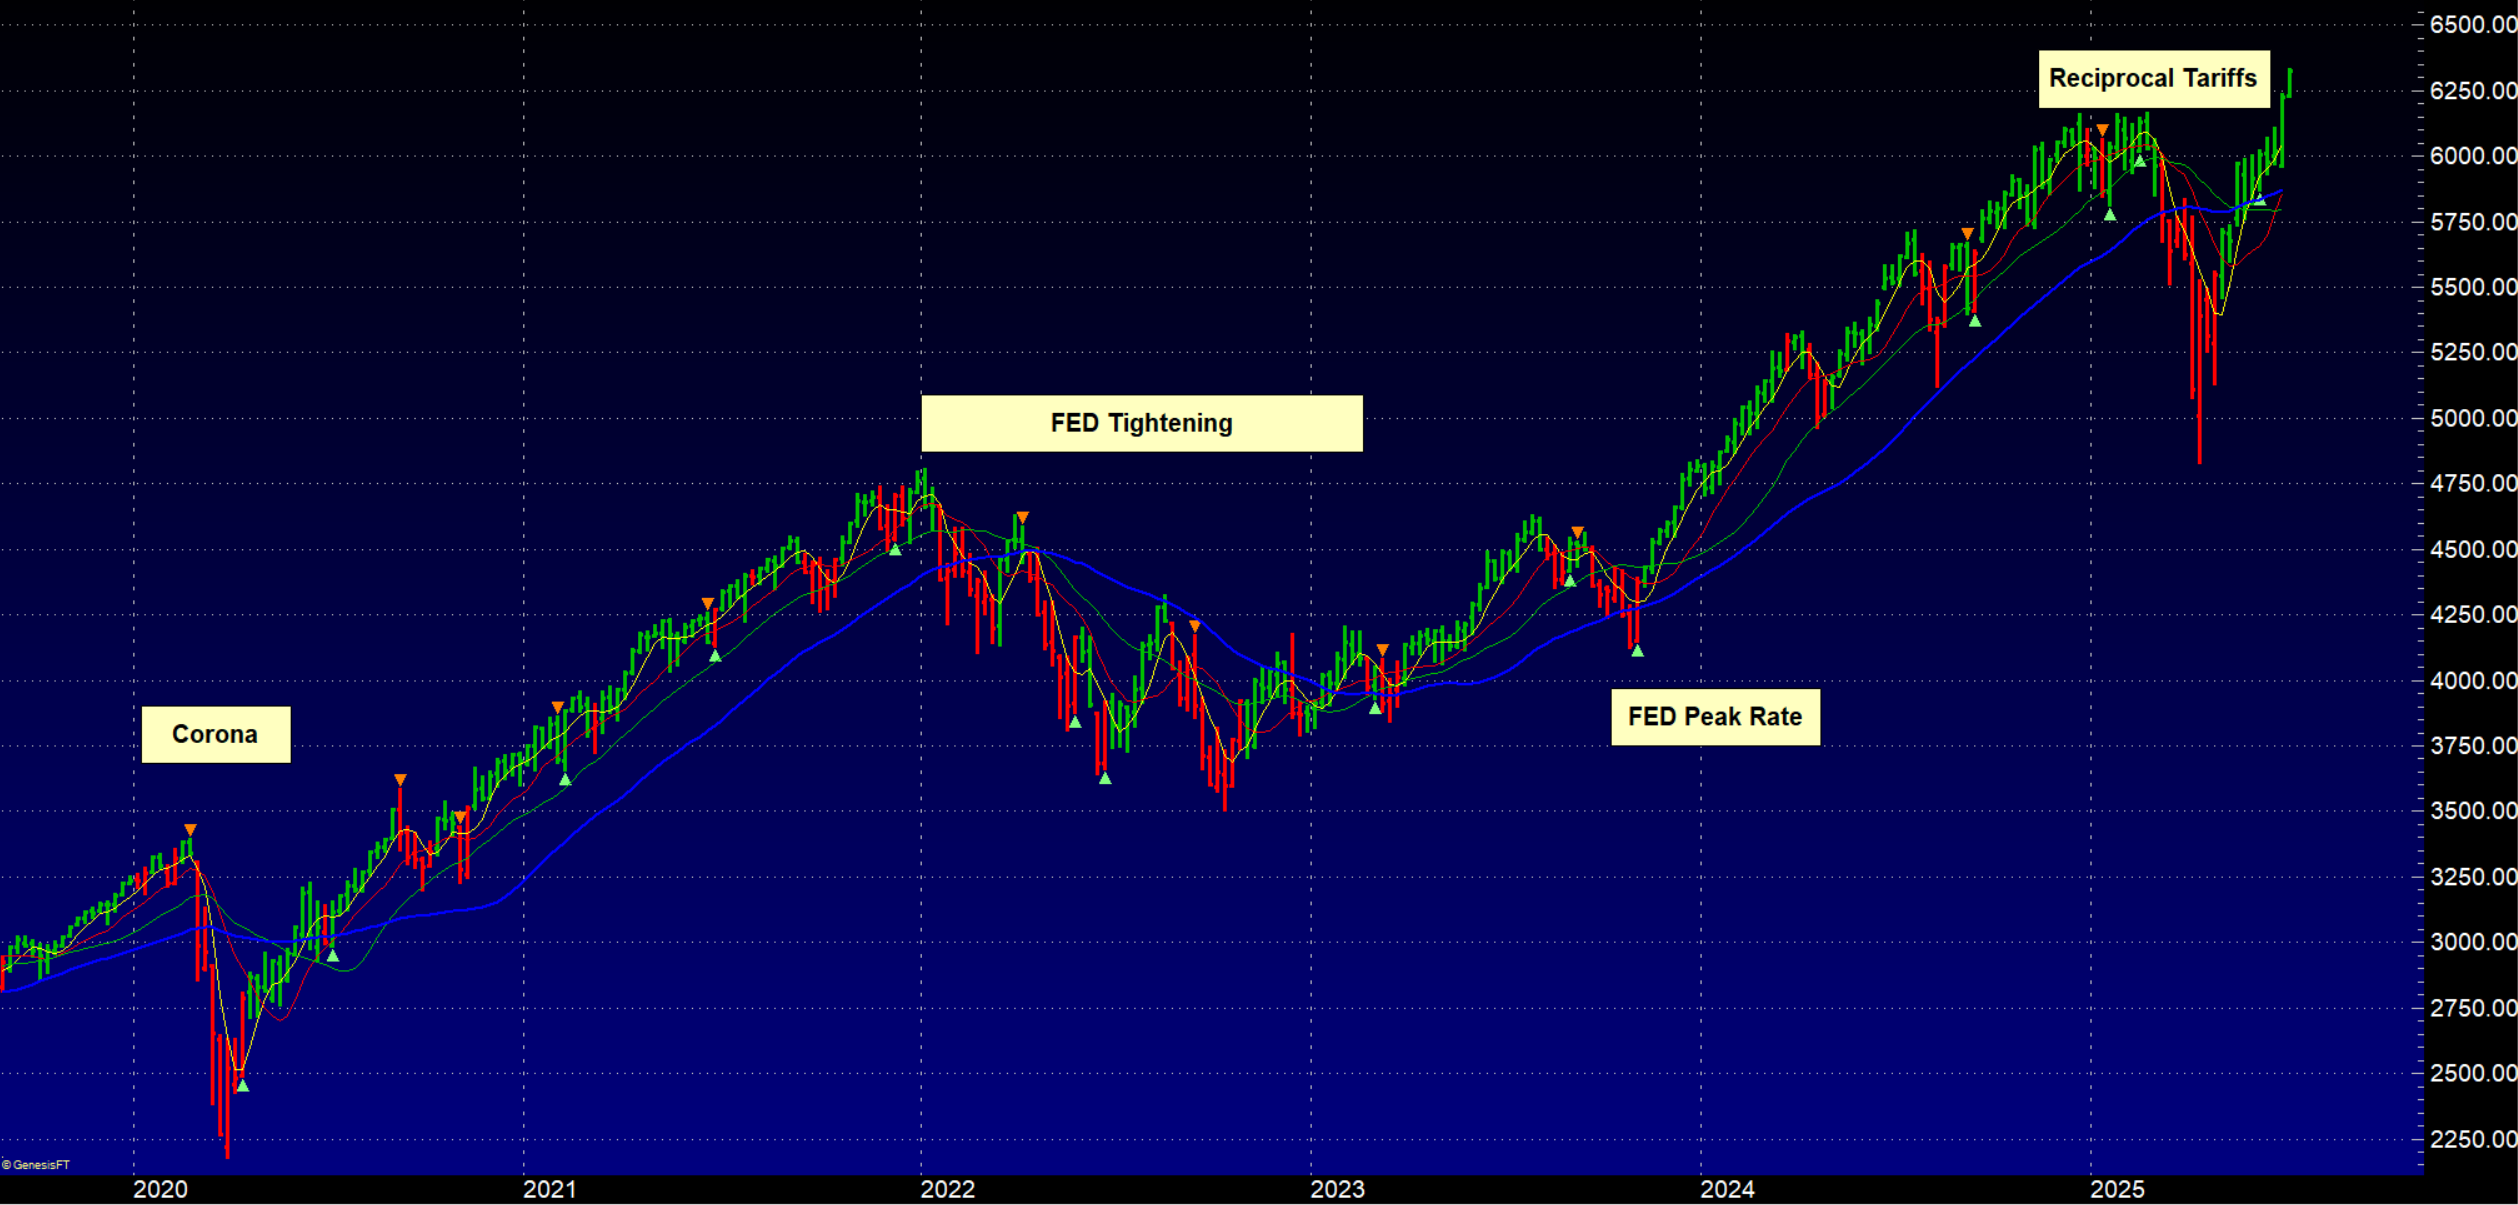
A weekly chart covering 2020–2025 clearly highlights prolonged market crashes and corrections, consistently marked in red. Prior to these downturns, the Indicator frequently registered either bearish impulses or distribution phases. At market bottoms, significant accumulation signals were typically present — underscoring the Indicator's exceptional capabilities as an early warning system and powerful buy signal.