Weekly
Loading...
Daily
Loading...
Scenario Outlook
A symbolic view of the support & resistance zones listed further down: from the last close, the nearest support (green) and resistance (red) zones, with three possible paths — Bullish, Sideways, Bearish — and the Markov model's latest-day probability for each. Follows the ES / SPY toggle below.
Loading scenario…
The Smart Money Tracker

This indicator tracks the market conditions on a very broad level by monitoring and combining numerous market-health indicators. This broad approach avoids the "this time is different" single-indicator trap, which worked in the past but fails in the future. It allows detecting early shifts in market regimes (bullish/bearish), induced by major market contributors.
However, it cannot look into the future — it tracks smart money "frontrunning" activity. "Sometimes, somebody knows ahead of time..." Sudden, unpredictable events cannot be detected.
Caution: Please note the daily uncertainty in the gauge bar around the pointer.
The S&P Indicator yields 3 basic signals:
- Bull/Bear Regime — displayed as green or red candles, showing the overall market direction.
- Bullish/Bearish Impulses — represent fast repositioning of market participants and yield long-range moves.
- Accumulation & Distribution — periods that translate into support and resistance levels. Different from impulses, Acc/Dist zones represent slow repositioning of market participants but nevertheless give rise to buying and selling zones at specific price ranges, which are often well respected even in the future.






Support & Resistance Zones
Key price levels derived from Accumulation and Distribution phases. These zones often act as magnets for price and can provide high-probability reversal or breakout areas.
Support Zones
| TF | Price Level | Type | Date |
|---|---|---|---|
| Loading... | |||
Resistance Zones
| TF | Price Level | Type | Date |
|---|---|---|---|
| Loading... | |||
Zones are calculated from historical Accumulation/Distribution phases. TF indicates Daily (D) or Weekly (W) timeframe. Use ES Futures prices for futures trading, SPY ETF for stock/ETF trading.
What is the Smart Money Tracker?
"When I first started my active trading career just before the great Corona crash, I dreamt of having an indicator that would have prevented me from buying stocks at the fragile top. This gave me the motivation to develop the Smart Money Tracker, which does exactly that: it turns red when you shouldn't buy, and turns green when good times are ahead.
Remember that no indicator is perfect, as markets are driven by millions of individual investors who often act in chaotic ways against each other. However, this indicator tracks what the influential big money is doing and finds the signal in the noise."
The Smart Money Tracker is a comprehensive market model designed to detect and quantify the hidden footprints of institutional market participants. Unlike traditional indicators that rely on a narrow set of metrics, this model integrates signals across a broad spectrum of market dimensions, including:
- Market Breadth: Analysis of advancing vs. declining stocks reveals the underlying strength behind market moves.
- Momentum & Volume Dynamics: Volume flows and uptick-downtick imbalances show buying pressure or exhaustion.
- Volatility Structure: Implied volatility across equity, bond, commodity, and sector markets is analyzed for risk pricing.
- Sentiment & Positioning: Indicators such as put/call ratios and skew index uncover investor sentiment and hedging activity.
- Economic Signals: Macro indicators like inflation, commodities, and economic surprise indices add broader context.
- Sector Rotation: ETF-based monitoring of sector flows shows capital rotation among industries.
- Technical Conditions: New highs/lows, trend strength, and market internals help confirm or contradict price action.
Each signal is processed by a backtested rule-based engine, contributing positively or negatively to the final outlook. The concept follows friction-based market theory: while noise dominates day-to-day moves, large institutions leave patterns when building positions.
No single signal is perfect — because this time is always different. But aggregating diverse data across timeframes, instruments, and regimes improves the chances of identifying the market's true direction early.
The D-Day Principle
Why did Eisenhower rely on the confluence of imperfect signals rather than waiting for certainty? Discover how the Allied invasion of Normandy explains why a composite market indicator works — and why single signals always fail.
What does the Smart Money Tracker show?
The Smart Money Tracker delivers a powerful, consolidated signal derived from a broad ensemble of individual market models. Each signal contributes to a holistic score that reflects the current positioning and momentum within the market. A higher indicator value signals a dominant presence of bullish forces — indicating that institutional investors are leaning long and that the market may carry upward momentum into the next session or even the following days.
When the indicator rises above -5, it reflects an accumulation of bullish pressure. The daily market chart responds visually by shifting to Green — a strong cue that buyers are in control. Historically, most sustainable uptrends begin with a green day and remain green until momentum fades.
Conversely, when the indicator drops below -5, bearish sentiment starts to dominate. A low score means fewer market participants are positioned long, and bearish momentum may be building. This often precedes corrections, pullbacks, or even deeper drawdowns. These phases are highlighted in Red on the indicator and the daily candles — a clear warning signal that downside forces are in play.
Impulse Days, Whipsaws & Range Markets
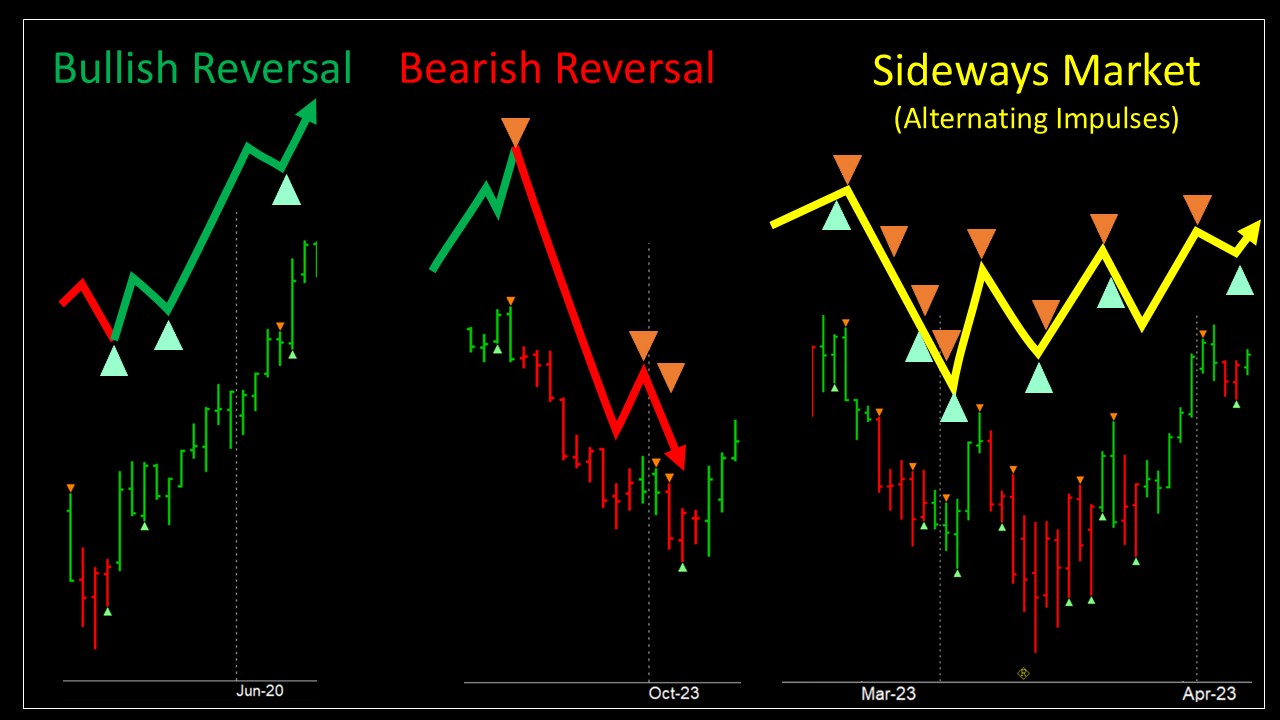
From time to time, the market undergoes significant internal rotations — sharp shifts in positioning that may not always show up in price alone. These sessions are captured as Impulse Days by the Smart Money Tracker, where the value swings dramatically within a single session. They are often the spark for new directional trends.
Bullish impulse days are visualized with light-green triangles, while bearish impulse days are marked with orange triangles. These visual cues help traders recognize when the underlying market dynamics are changing — even before price action confirms the move.
But not every impulse leads to clean trends. In volatile or indecisive markets, impulses may appear in both directions on consecutive days. This signals a whipsaw environment or range-bound market, where strategies must adapt.
Impulses
Beyond simply indicating whether the market is likely to go up (Green) or down (Red), the Smart Money Tracker reveals a more nuanced picture through the detection of market impulses and phases.
Sudden and significant shifts in bullish or bearish positioning create sharp changes in the indicator, which are identified as impulses. When no counter-impulse emerges in the following one or two sessions, the market typically begins to trend in the direction of the impulse.
Impulses often appear at critical turning points in the market. A Bearish Impulse following a prolonged rally can signal the start of a correction. Conversely, a Bullish Impulse after an extended decline can mark the beginning of a powerful rebound.
Market Phases
In addition to impulses, the Smart Money Tracker enables the identification of broader market phases as described by the Wyckoff method: Accumulation, Bullish Trend, Distribution, and Bearish Trend.
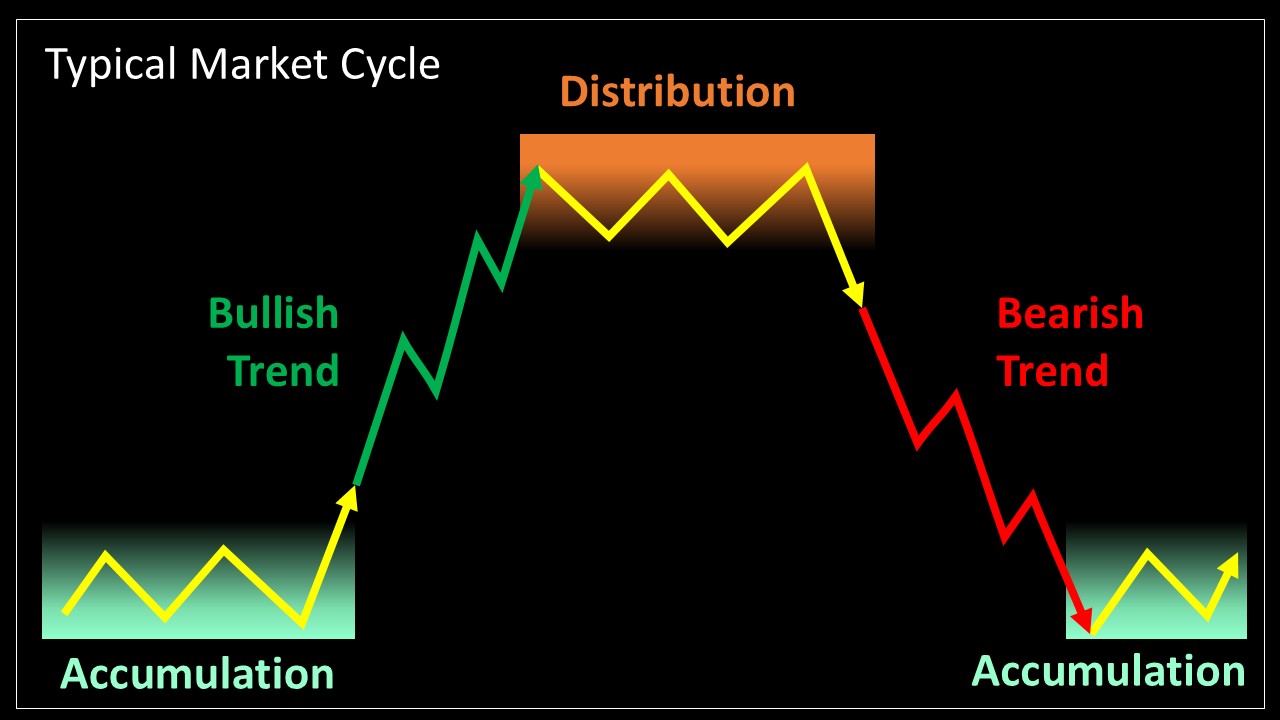
Accumulation phases occur when dominant market participants discreetly build positions at lower price levels, typically following a market decline. Distribution phases involve major players unwinding positions after significant rallies, frequently signaling the onset of a correction.
How to use the Smart Money Tracker
The Smart Money Tracker is designed to help you spot potential market shifts at a glance. Its intuitive color system — GREEN for bullish setups, RED for bearish pressure — allows for rapid interpretation.
Use the Daily Indicator to assess short-term market dynamics over one to a few days — perfect for tactical trading and precise timing. The Weekly Indicator offers a broader view, capturing multi-week to multi-month trends and giving investors strategic insight into longer market regimes.
Trades can be executed using S&P500 futures contracts, such as ES (E-mini S&P500) or MES (Micro E-mini S&P500), as well as correlated index products like NQ, MNQ, or the SPY ETF.
When the Indicator turns GREEN, it often marks a favorable environment for initiating LONG positions. Conversely, RED signals indicate rising uncertainty and a shift toward defensive sentiment — excellent moments to reduce exposure or consider SHORT positions.
The Smart Money Tracker can also be used as a general Market Filter for timing SWING trades in US stocks. During Bullish Trends, LONG breakout strategies work best, while in range-bound markets (Accumulations or Distributions), mean-reversion strategies perform better.
Uncertainty Bands
Sometimes, not all required data is available exactly at the time the calculation is performed. This absence introduces a degree of uncertainty into the Smart Money Tracker. To reflect this transparently, the chart displays two white boundary lines surrounding the indicator value, which represent the maximum possible variation that could occur due to missing inputs.
This uncertainty becomes especially critical when the indicator hovers near the Bull/Bear threshold of -5 — a key level often signaling major directional shifts. Fortunately, most of the missing data is retrieved the following day and integrated retroactively.
Further Reading
Historical Examples
See how the Smart Money Tracker performed during major market events: Corona Crash 2020, Fitch Downgrade 2023, Fed Peak Rates 2023, Trump Tariffs 2025, and more.
View Historical ExamplesGlossary of Terms
Understand key financial terms used throughout the Markets in Vitro platform.
View GlossaryData Sources
ES Futures: Stooq (daily OHLC) | Indicator Calculation: Proprietary algorithm based on price action and market structure