Is Inflation Trumps solution?
Current Markets are choppy and indecisive. Our Smart Money Tracker reveals why:
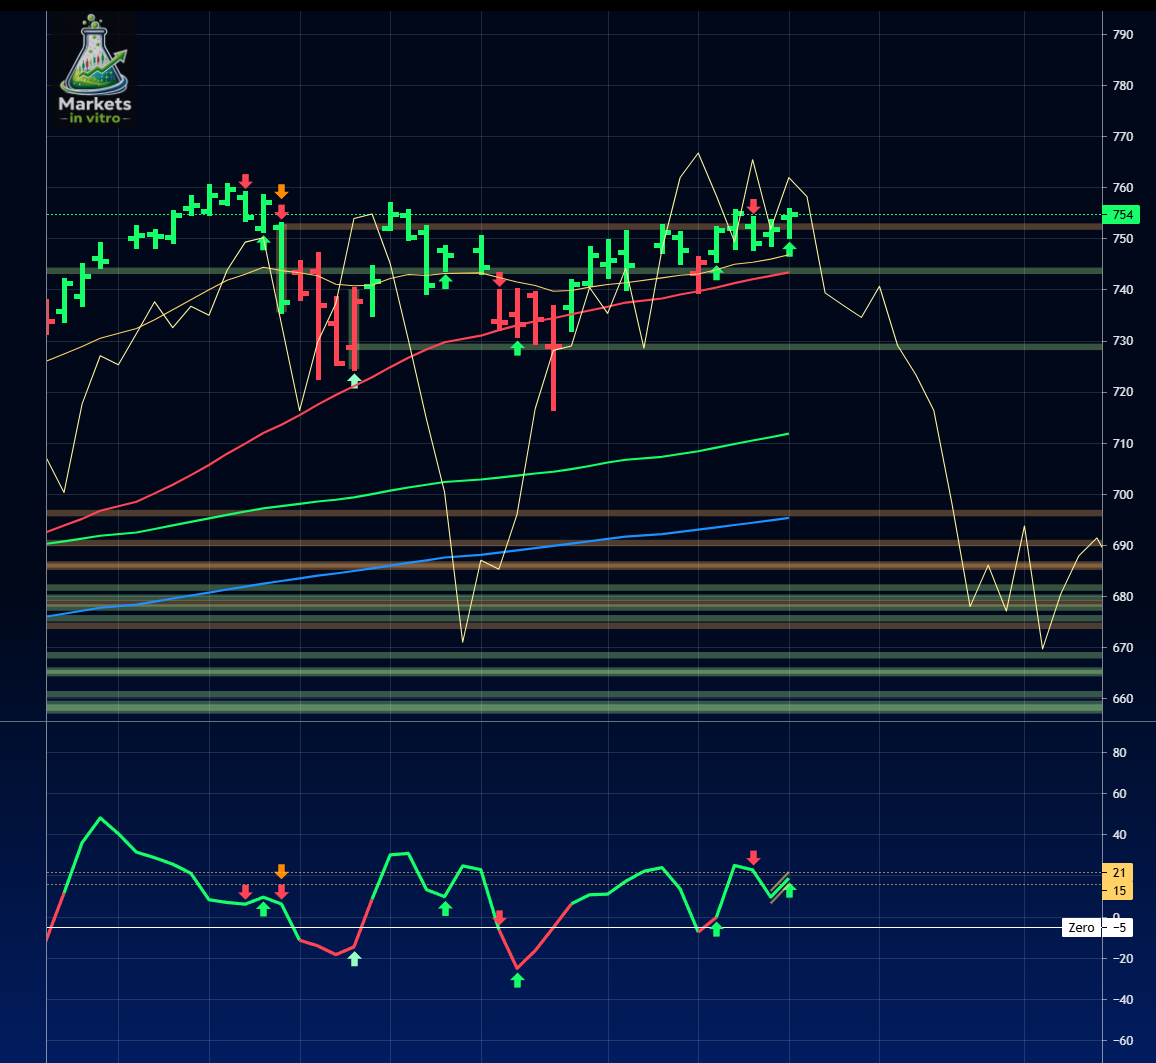 Since June we see alternating Bearish and Bullish Impulses, combined with alternating Accumulations and Distributions. This is Rotation going on, yielding a choppy sideways market, perfect to loose money.
In physics, systems tend to start to oscillating heavily, when they approach a regime which is less stable. Compared to financial Markets, we could transfer this model and define a stable Bull-Trends , which is followed by a heavily oscillating Top-Formation. Well, we don’t know yet if this is a top or just a sideways consolidation. However, The smart money tracker reveals only thin support and resistance lines in teh current market range from 730 to 750 (SPY). Underneath, there is a massive gap, caused by the massive April to June rally, which happened on very thin volume. No, we don’t use the term “Market-Manipulation” to explain this rally, we just note what happened…
Solid support is found around the level 680. Could we see a pullback to 680?
Currently we are missing solid risks to trigger such a correction, our Risk Analysis can’t detect any reaqsonable risks in the system right now.
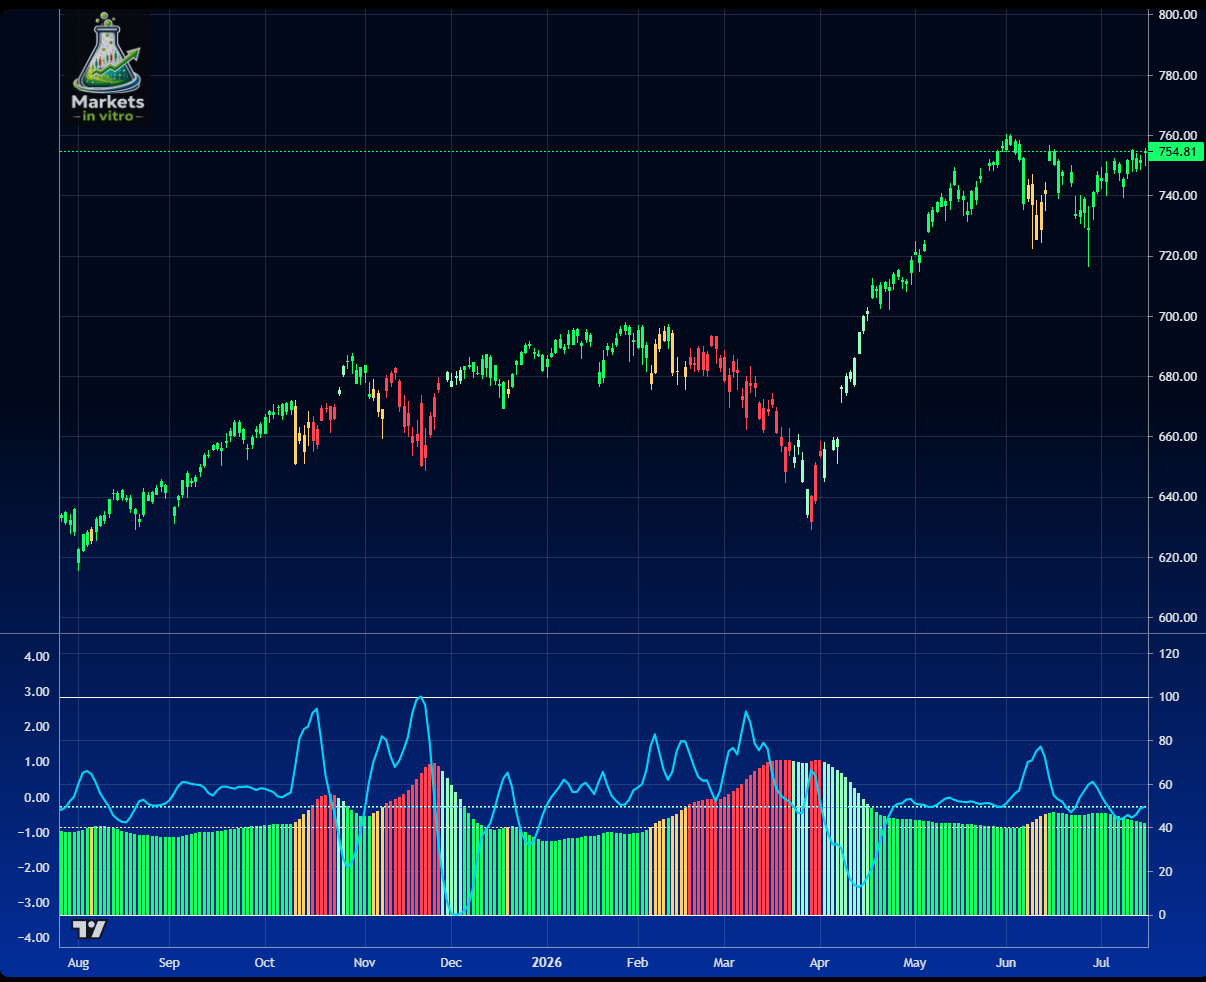 However, risks are always there:
1. The US-Debt Timebomb, caused by exuberant spending of the Trump administration and an upcoming Debt-refinancing wall
However, risks are always there:
1. The US-Debt Timebomb, caused by exuberant spending of the Trump administration and an upcoming Debt-refinancing wall
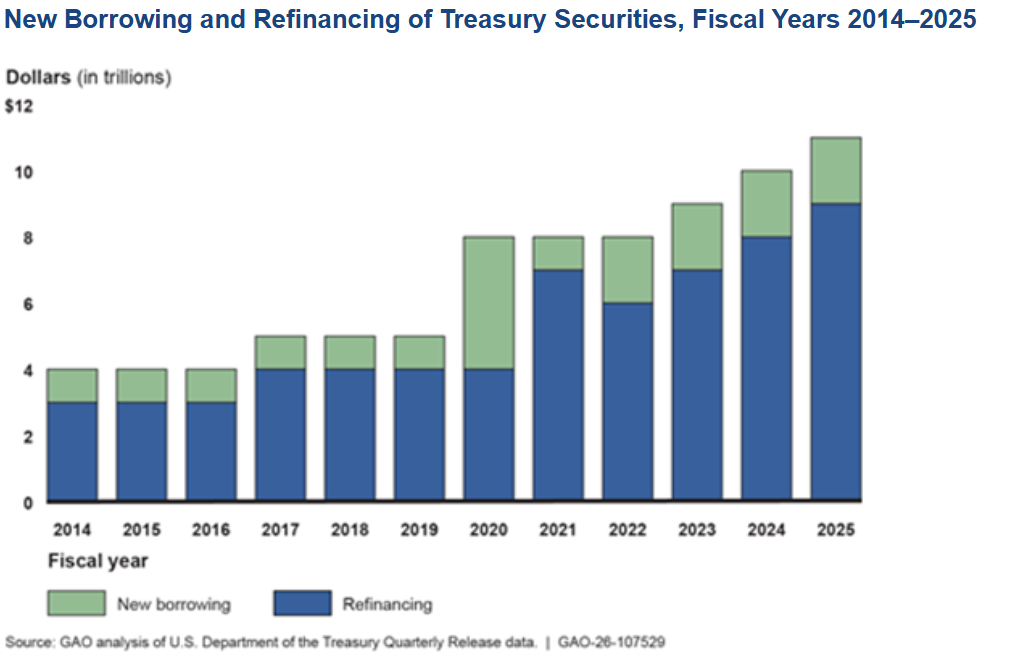
US Borrowing
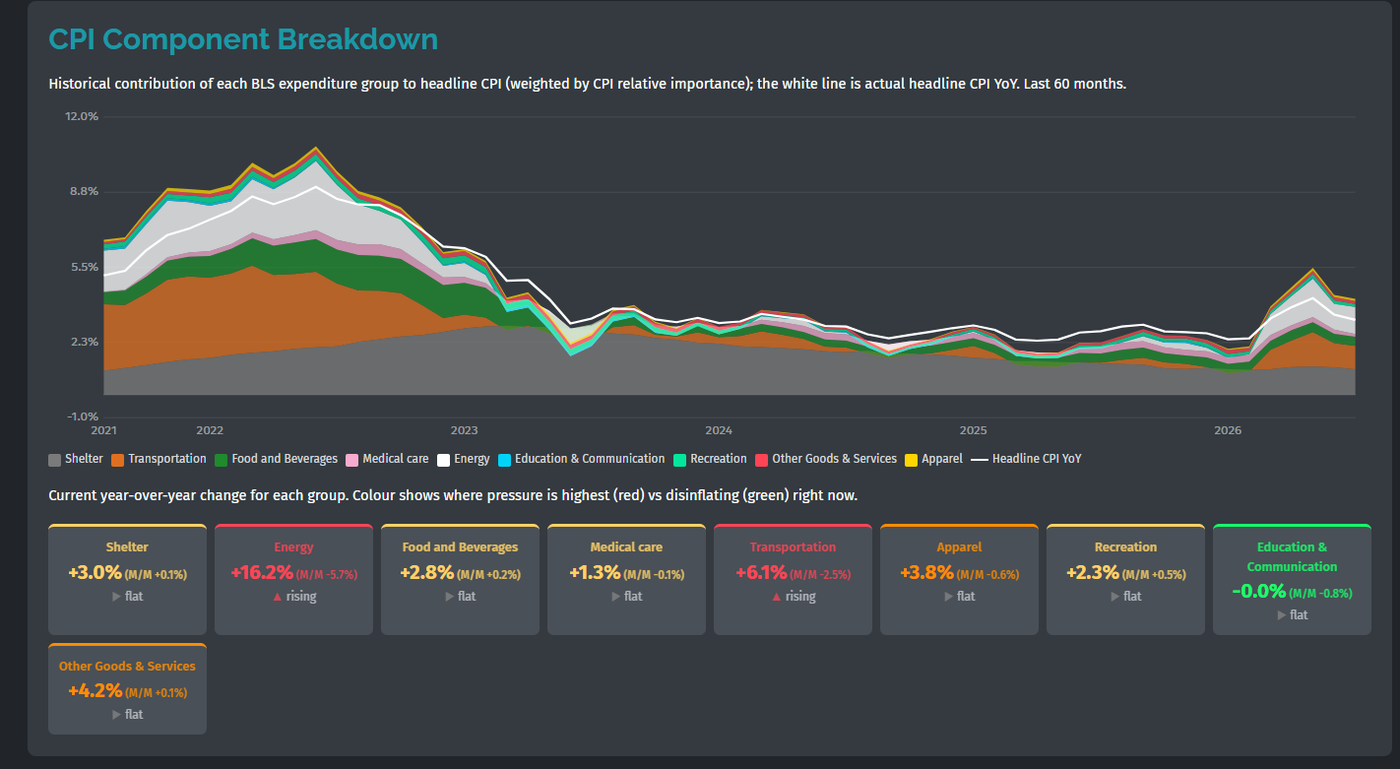
CPI Component Breakdown
, the US Treasury yields are in a consistent uptrend and might bust through the critical 5% level
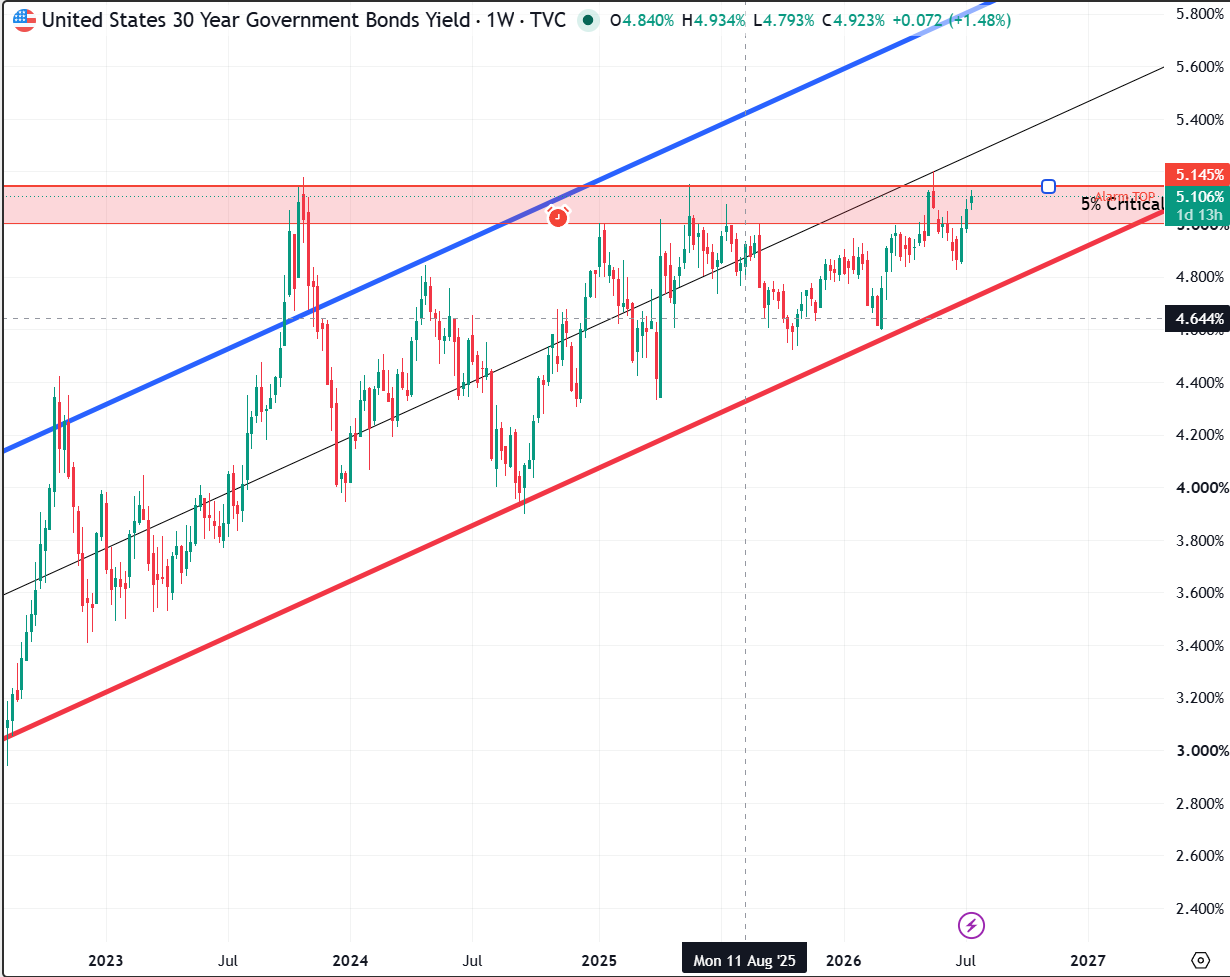
US 30 year Government Bond yield
- The global impact of the One-Man Tweet-Show, causing new wars in teh Middle east and potential Oil price shocks
-
The Private-Credit shadow makret, now believed to be larger than the regulated credit market.
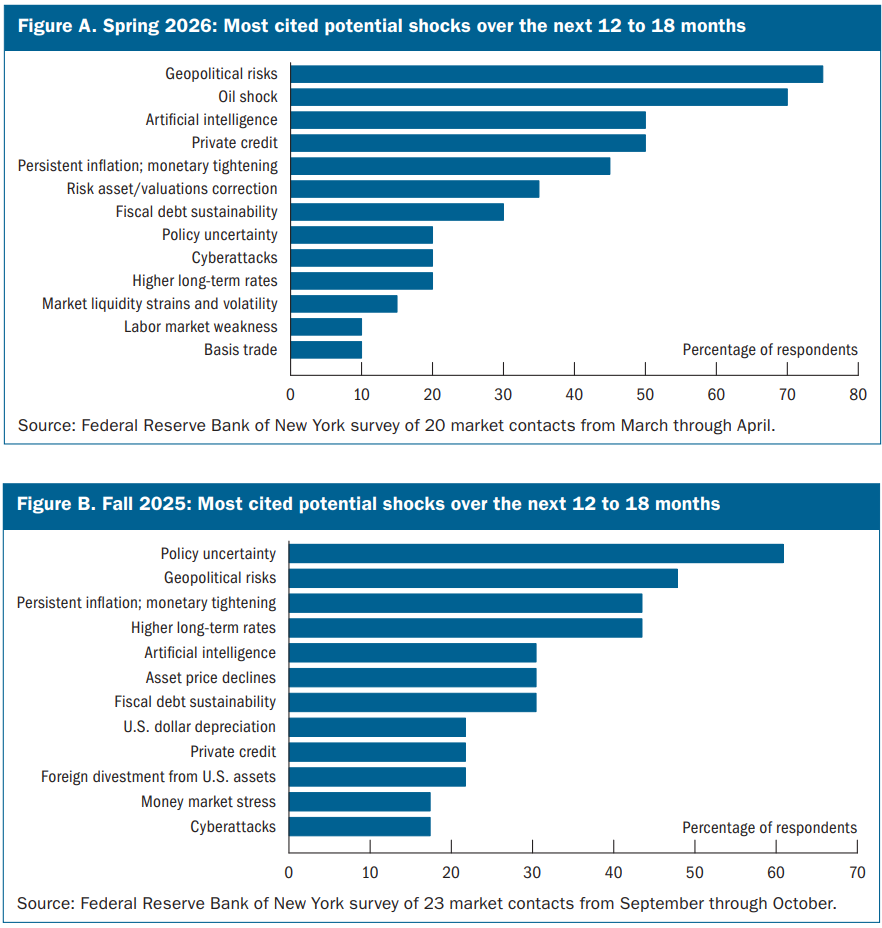
-
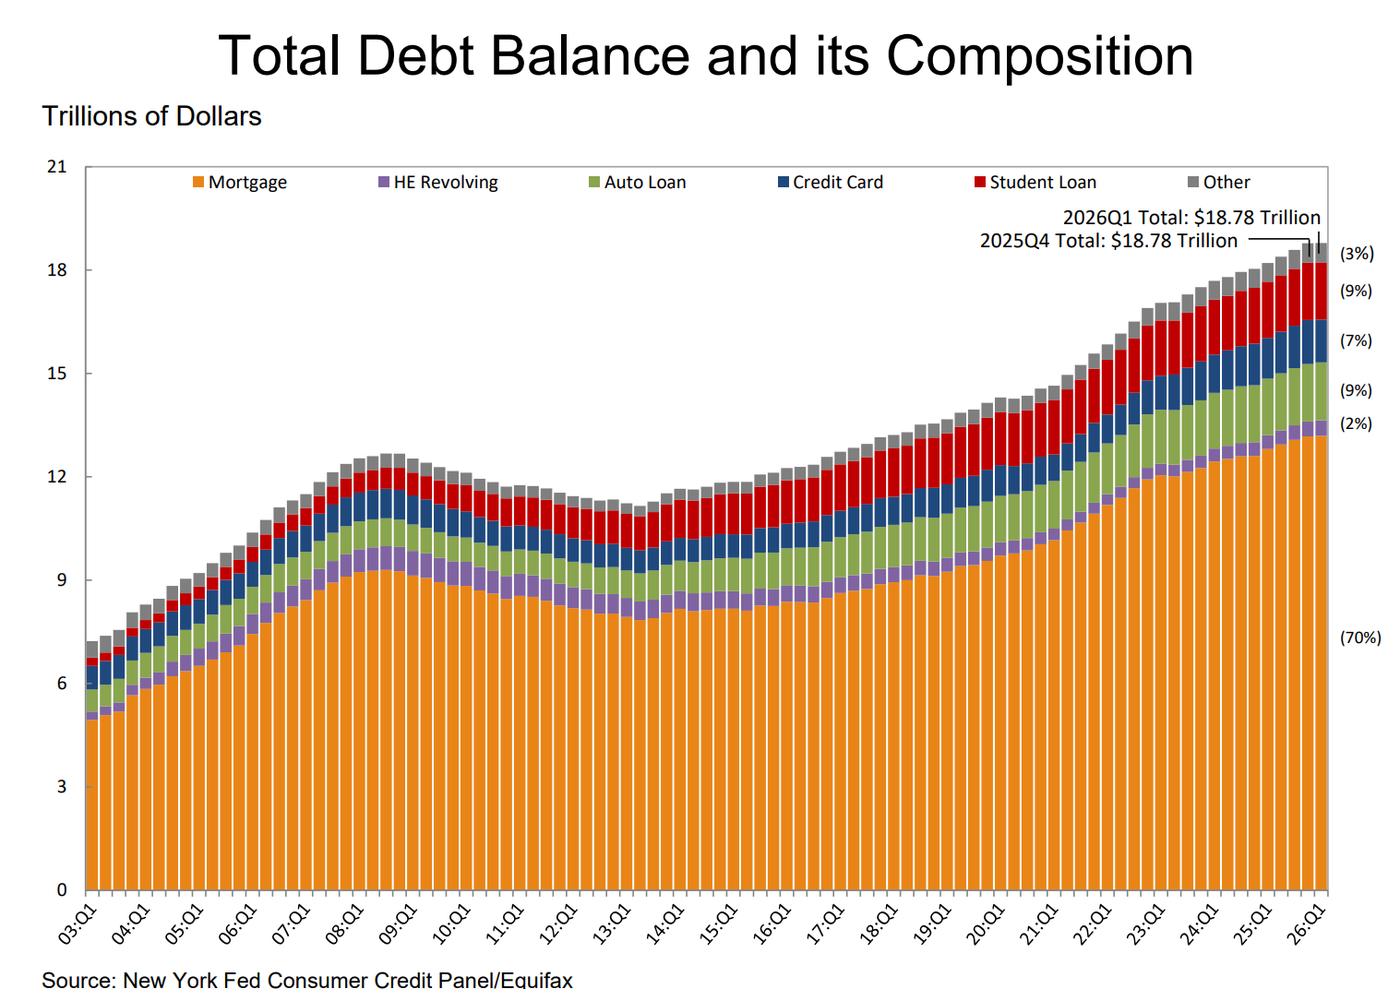
Total Debt Balance and its Composition
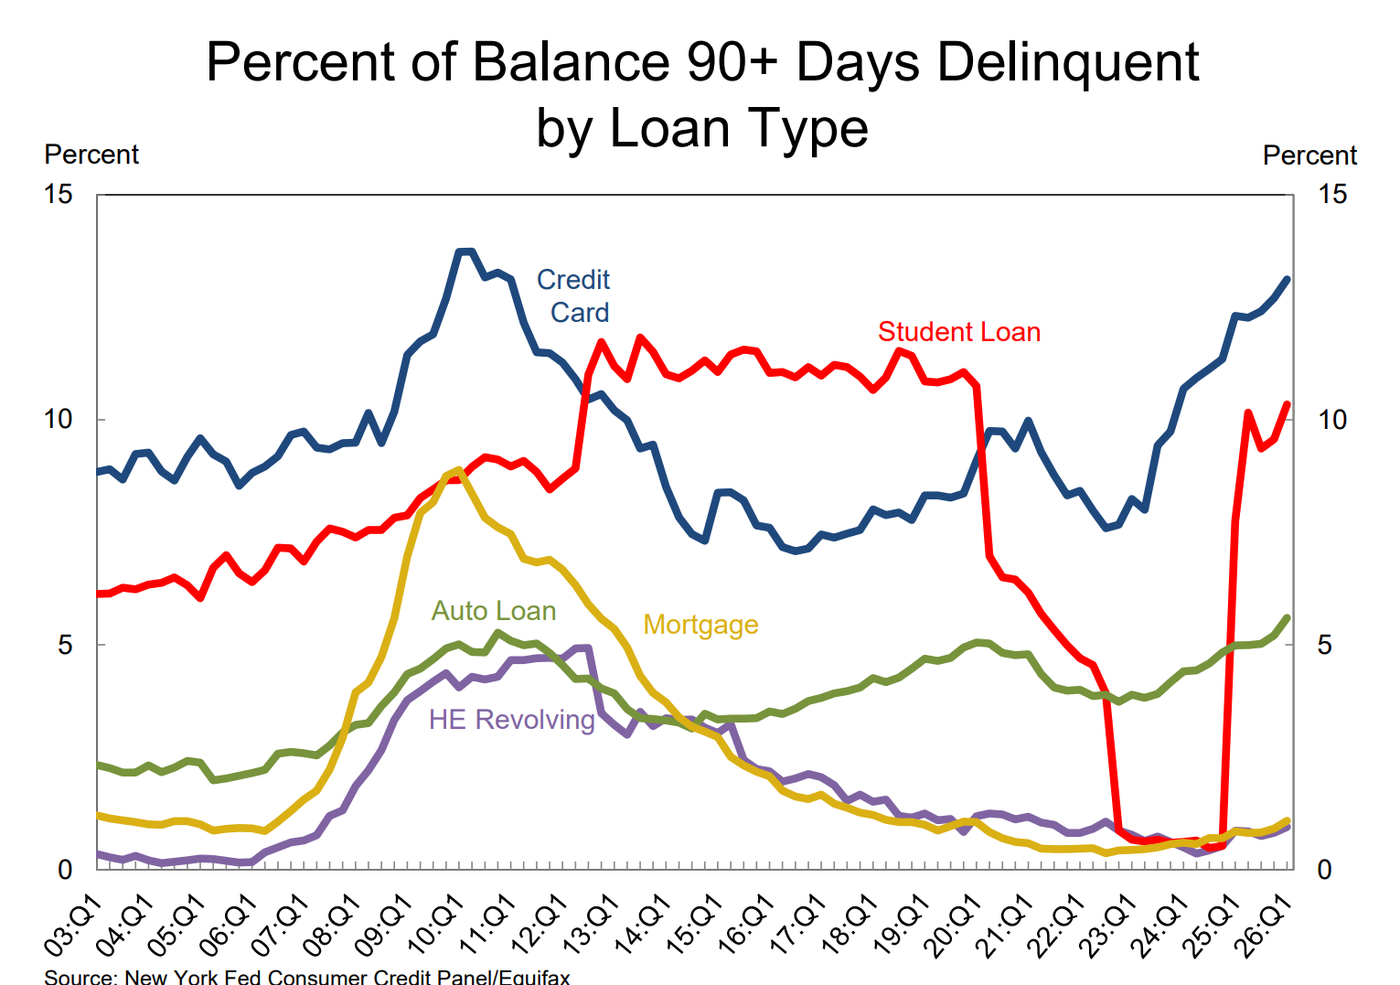
ercent of Balance 90+ Days Delinquent by Loan type
What to make of all of this?
The market prices those only as mid to long term risks and seems to focus mainly on AI Hyperscalers, Datacenters and Semiconductor stocks, thus creating this high-volatility environment ahead of the Q3 Earnings season. But at the same time, The Energy sector is the strongest, indicating that we ar in the last phase of the recent bull run.
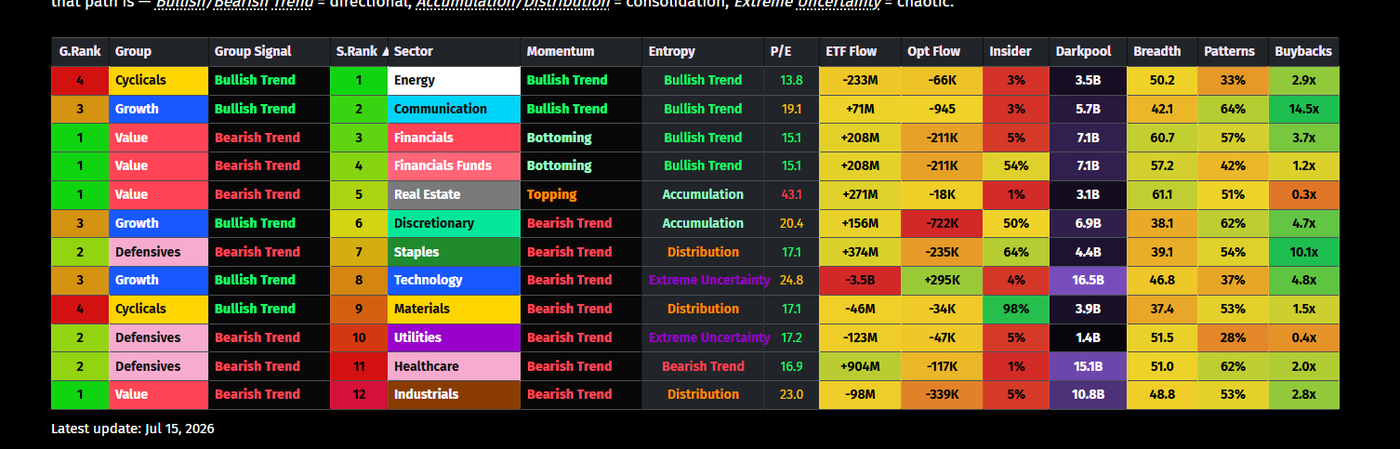
The best opportunities lie in single stocks and not in broader indices, as money rotation creates choppines. Find the inflows into single stocks by using our MarketsInVitro Stock-Screener, which allows you to filter Sectors, statistically approved patterns, Accumulation regimes, Market Outperformance, Insider Trades, Darkpool trades and many more.
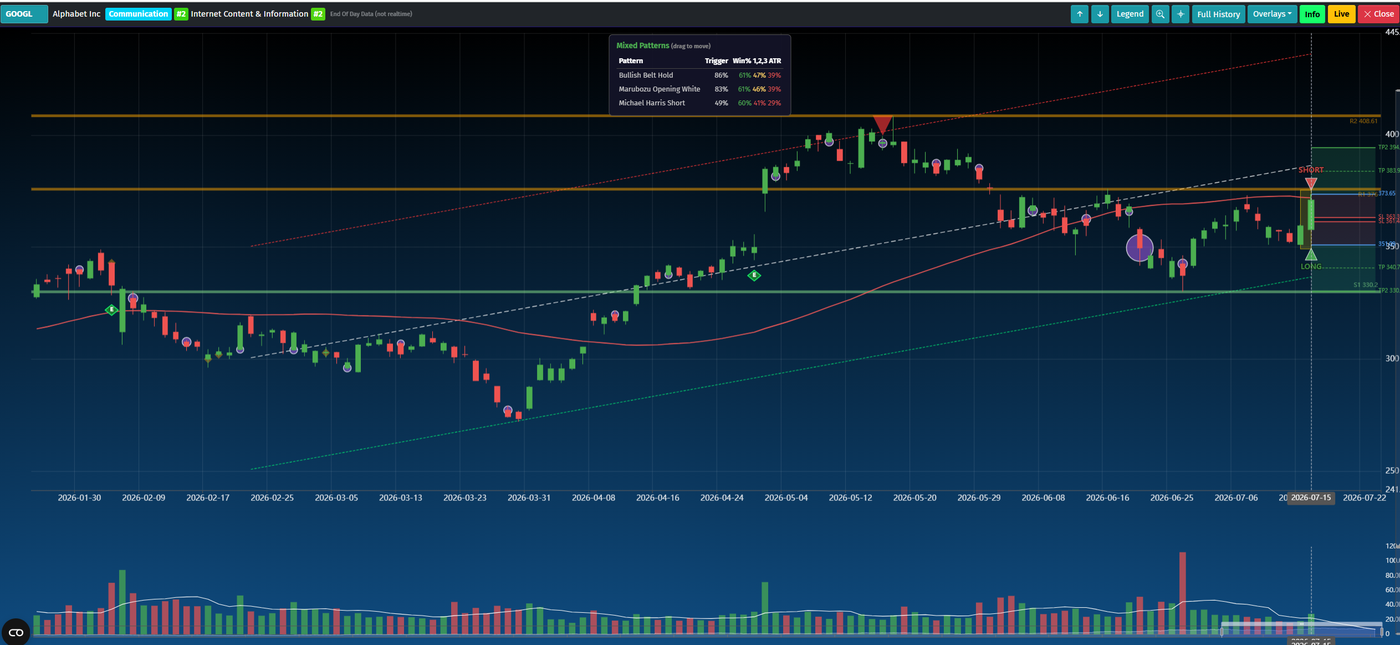
Darkpools detected in GOOGL, around the support-level of 33 $, and a statistically relevant bullish pattern yesterday
Darkpools detected in GOOGL at the support area around 33 wich a statistical relevant bullish pattern