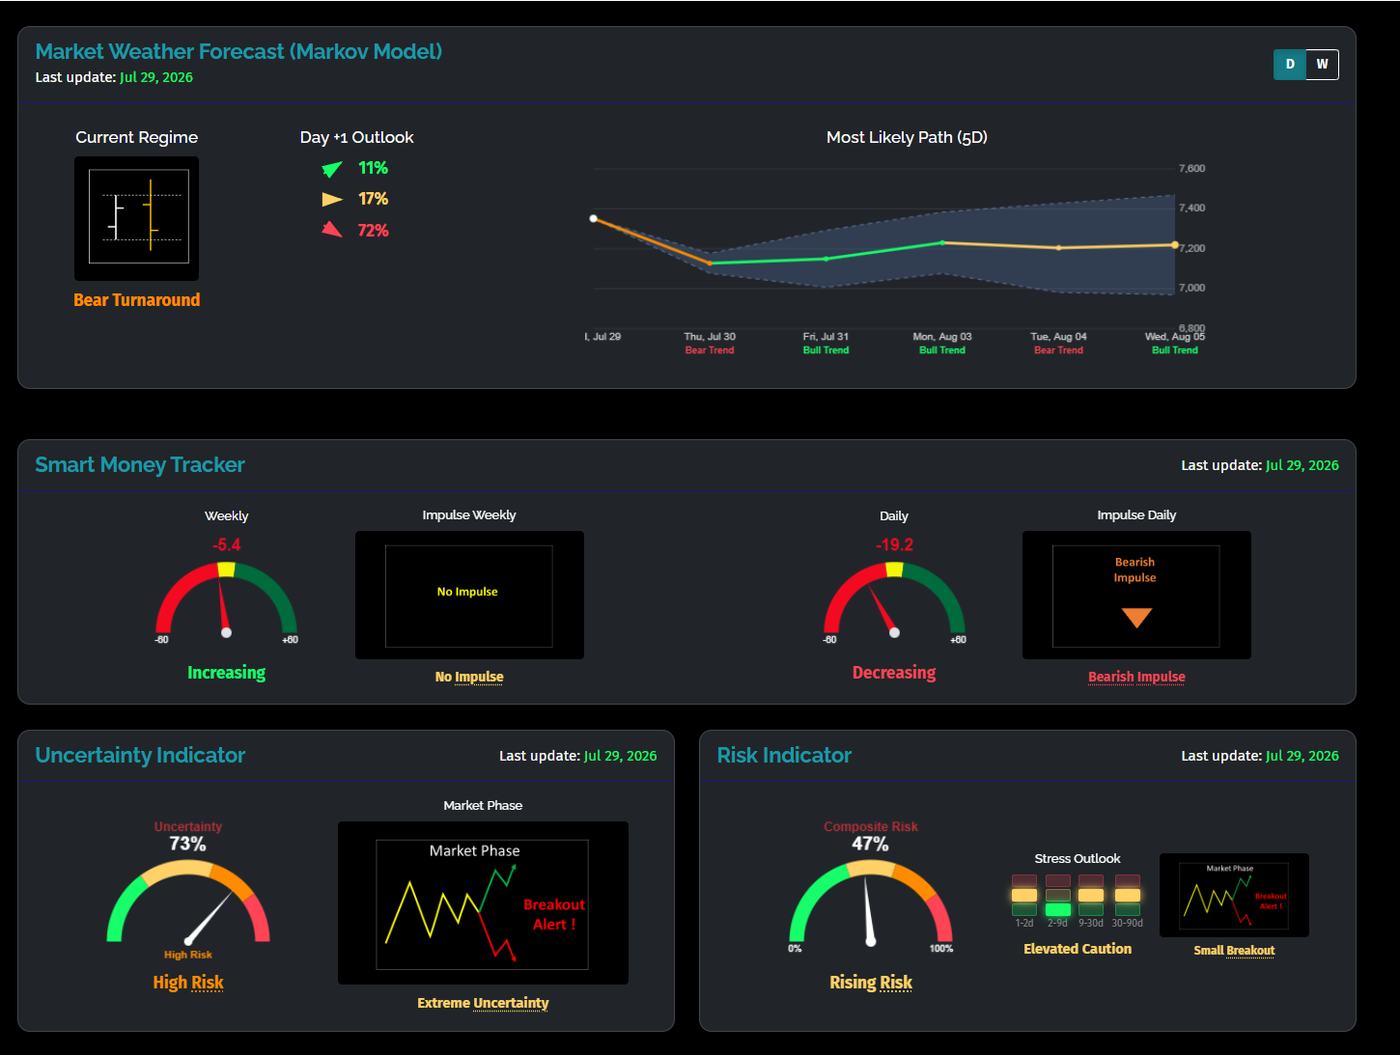
Indicator Overview - Bearish Impulse and rising Risk
The market narrative shifted decisively after the Fed delivered a hawkish hold, keeping rates unchanged but signaling that the fight against inflation is far from over. A rare three-member dissent in favor of a rate hike, combined with persistent inflation concerns and elevated oil prices, pushed long-end Treasury yields sharply higher and weighed on risk assets. Growth and semiconductor stocks led the selloff as investors questioned whether higher-for-longer rates could compress AI-driven valuations. Reuters: https://www.reuters.com/business/feds-hawkish-hold-muddies-path-stocks-bonds-2026-07-30/
On the surface, Inflation seems stable, mainly due to the decrease in oil price, prior to the new escalations with Iran. However, with every day the Street of Hormuz remains closed, and with every new burning oil refinery, the global oil crisis is going to have severe side efffects on the economy. Our Inflation Tracker shows that Energy prices affects other components of the CPI as well, with Transportation up 6%, Shelter, Apparel and Other Goods and services on the rise.
While the FED not acting against rising inflation, the Capital-Markets are, especialy on the long-end, with the 30-year yields breaking to highs, which we haven’t seen since 2007
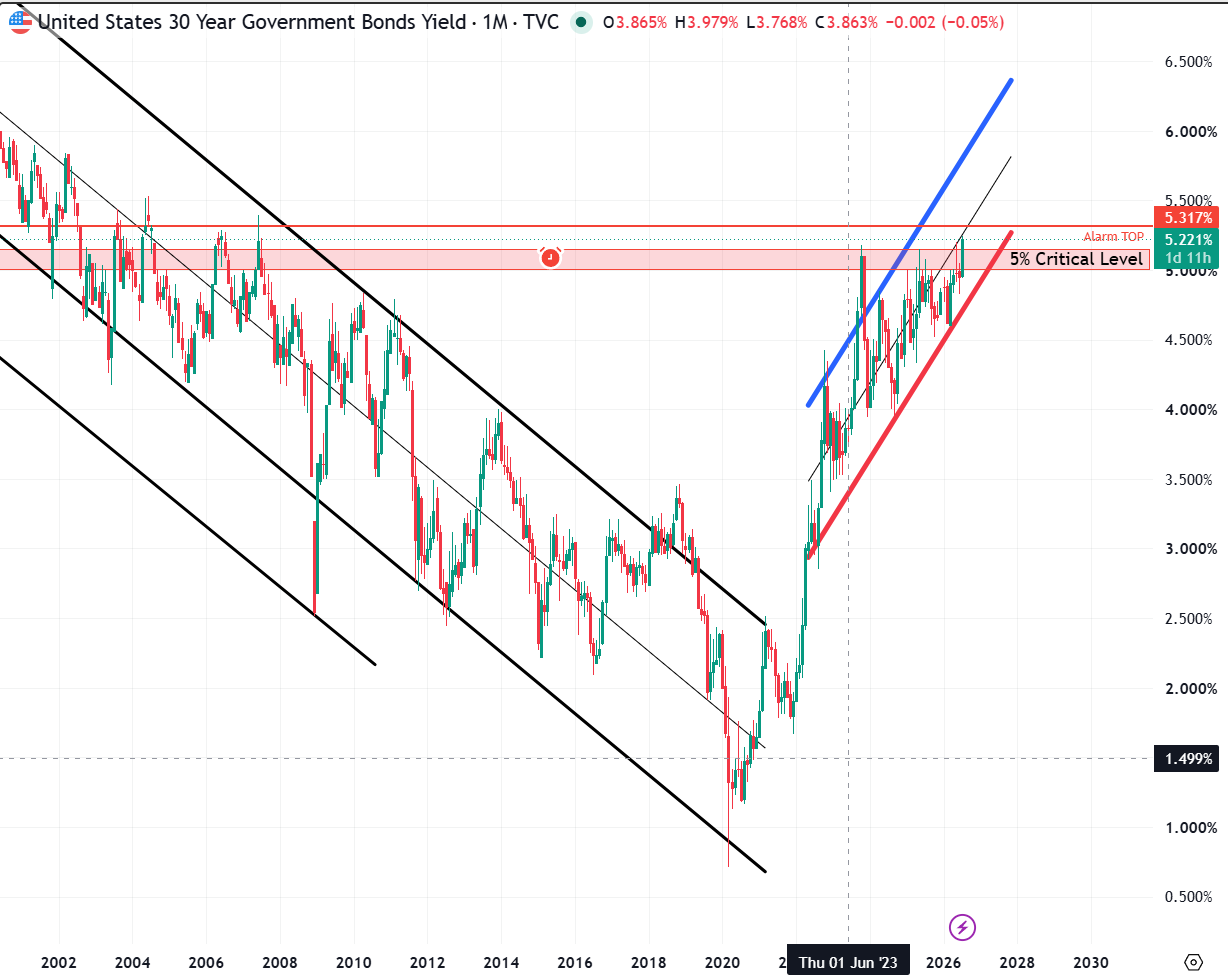
US 30 year Treasury Yields
This has detrimental effects on hause and auto loans and punishes companies which rely on cheap money for massive investments: Growth and Technology stocks, Hypersaclers, Semiconductors are under heavy pressure, while teh market is now supported by Healthcare, Consumer Defensives and Real Estate. Real estate has often been an early warning sign for an upcoming Recession, allthough our recessin indicator is not signaling a recession in the near term (Economic Cycle Analysis).
The Market is no longer supported by the MAG 7 but actually it is broadiening: more stocks are going up than gown. Still id does not feel like q lealthy market, as it is dragged down by the heavy weights:
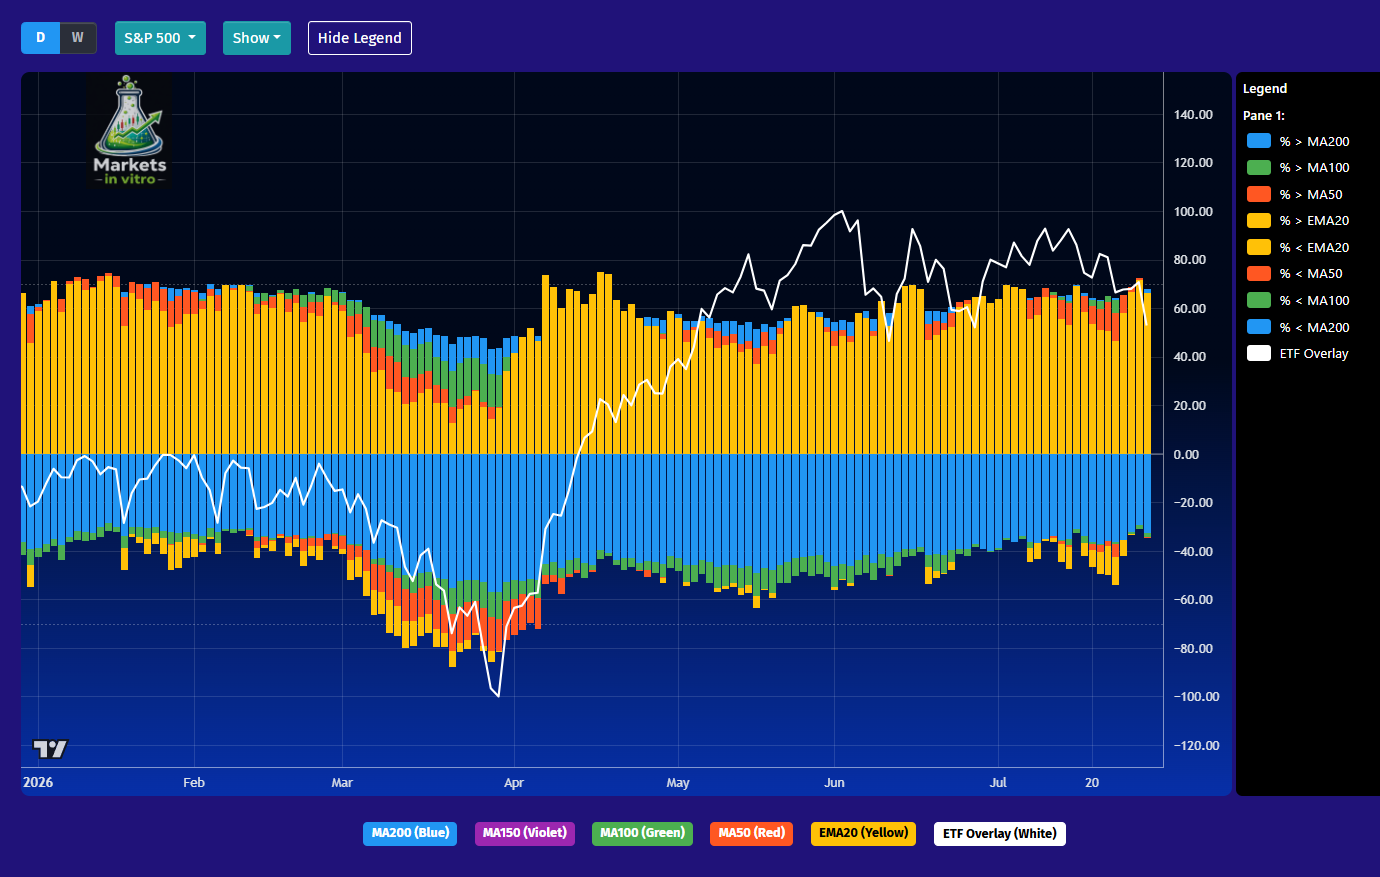
MArket Breadth: More stocks are making new highs, while the index is dragged lower by heavy-weighted Megacaps
Nvidia, once the biggest stock in the world, is a good example.
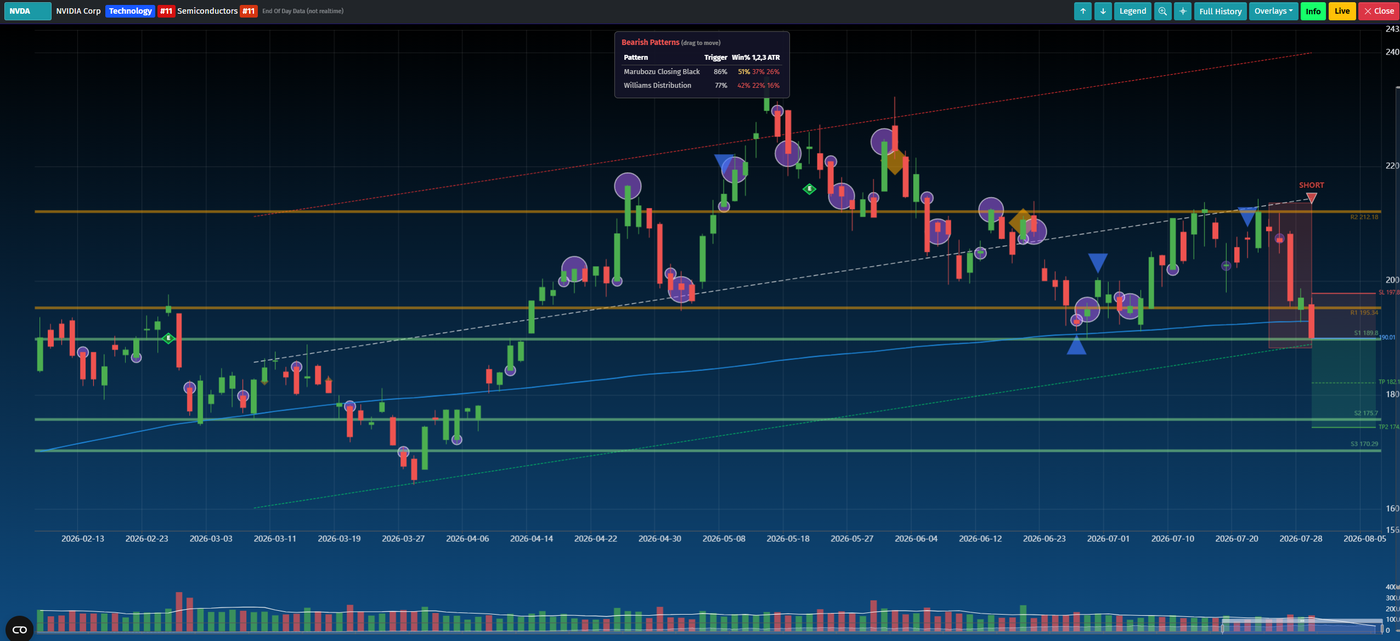
Analysis Chart of Nvidia - MAssive Darkpool Clusters, Insider Sells and Politician sells at the top
Overnight, earnings took center stage. Microsoft restored confidence in the AI trade, beating expectations with strong Azure and Copilot momentum, sending shares higher in after-hours trading. Meta, however, disappointed with softer guidance, reinforcing the market’s increasingly selective stance toward mega-cap AI names. Attention now turns to today’s U.S. Q2 GDP, Core PCE inflation, and earnings from Amazon and Apple, which could determine whether the recent tech correction deepens or turns into another buy-the-dip opportunity. Reuters: https://www.reuters.com/business/feds-hawkish-hold-muddies-path-stocks-bonds-2026-07-30/ • MarketWatch: https://www.marketwatch.com/livecoverage/stock-market-today-nasdaq-dow-s-p-500-meta-microsoft-earnings-fed-interest-rates-amazon-apple
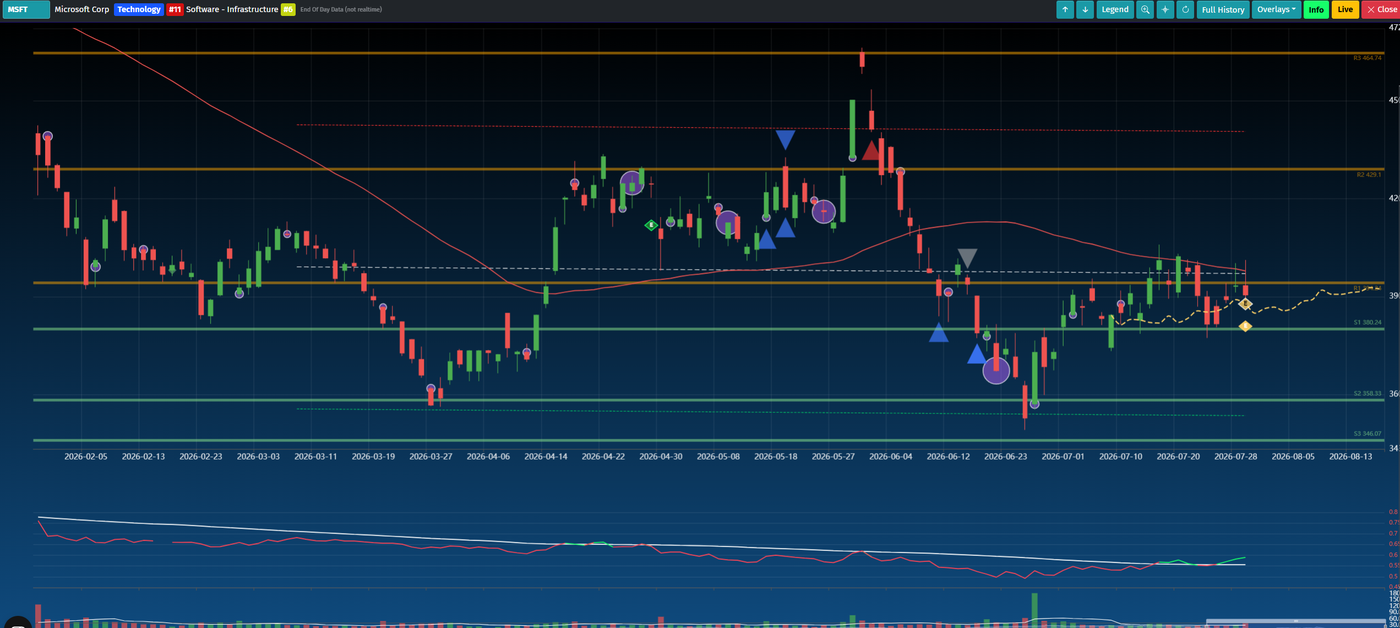
Microsoft Chart - Pre Q3 Earnings
Outlook: The context for stock investment worsens, with rising yields, as bonds and treasuries become a real alternative to risky stocks. For now defensive stock still hold up, while the tech-heavy NASDAQ leads the losses. A lot of de-levearging has already taken place and this, together with news or (fake) tweets kan spark hefty recovery rallies at any time. But for now the trend is bearish, with the Smart-Money Indicator pointing towards lower lows ahead. The Sell-off could even acelerate, once losses force investors to liquidate also there positions in defensive stocks, which, for now, are still holding up.