Market Analysis
The market regime has changed completely, from tariff-panic over a defensive rotation during early October into full Risk-On mode.
Our Composite Risk tracker flipped green again — optimism is back. Bond markets are quiet, credit spreads remain low and volatility has drifted back into “normal” territory.
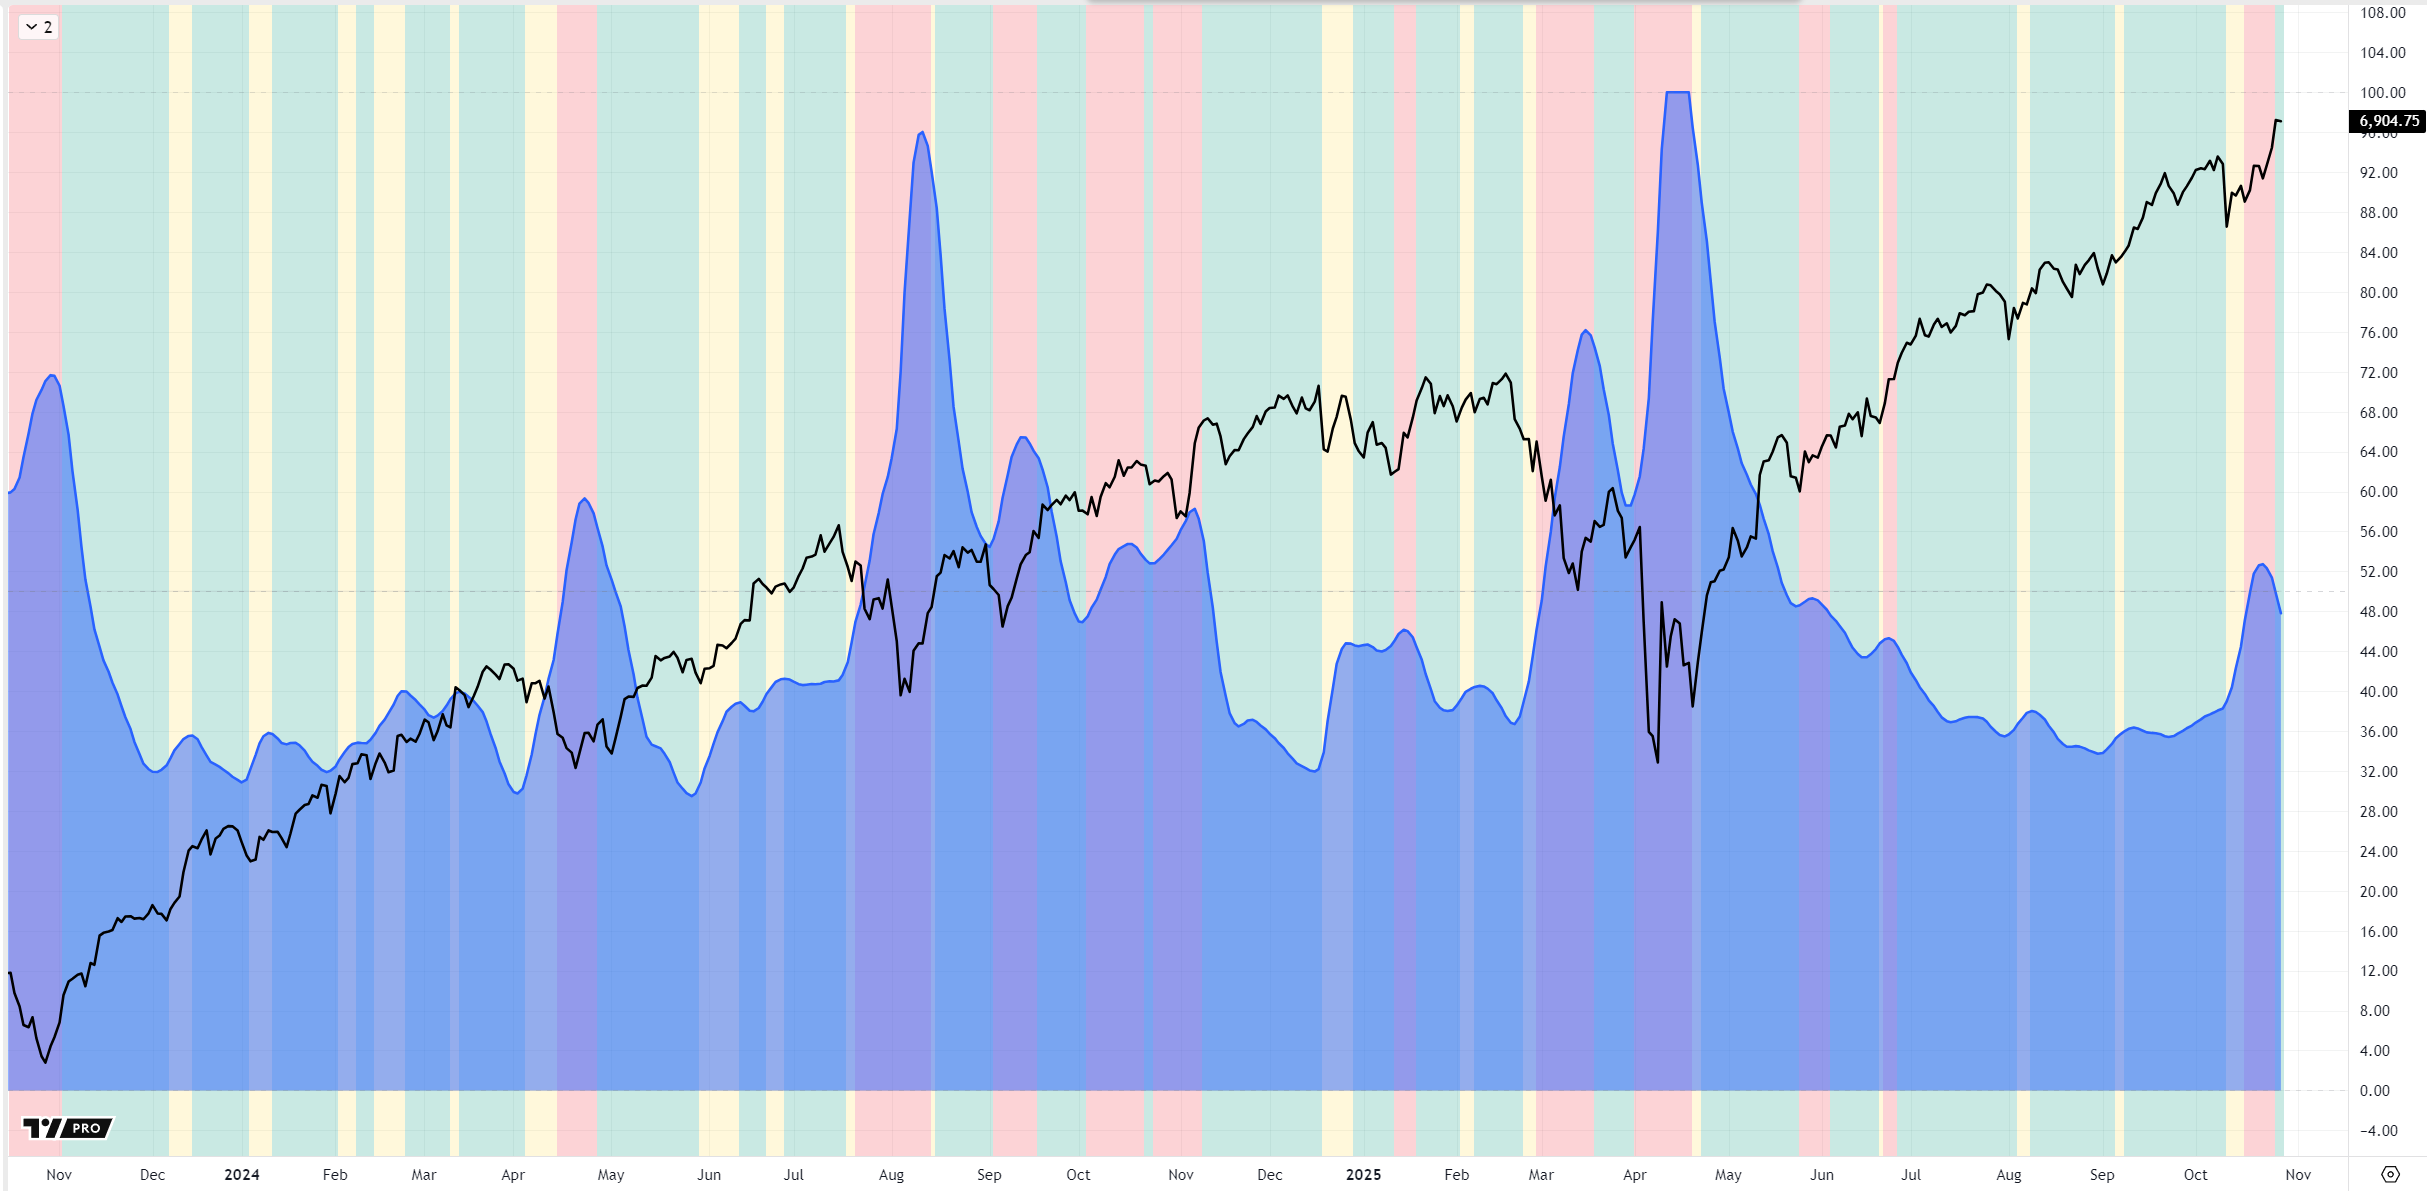
In a surprisingly short span, the S&P 500 Indicator has surged through two consecutive Bullish Impulses, climbing from deeply bearish into the “extreme bullish” zone (above 30) — yes, the kind of move that makes charts look like a sugar rush.
The Weekly S&P 500 Indicator is flashing Bullish Impulses and Accumulation signals now.
Is this the kickoff for the Christmas rally?
And yet… how are markets ignoring the cracks appearing in the US economy, global trade stress and the new private-credit debt shadow lurking?
Sector Rotation
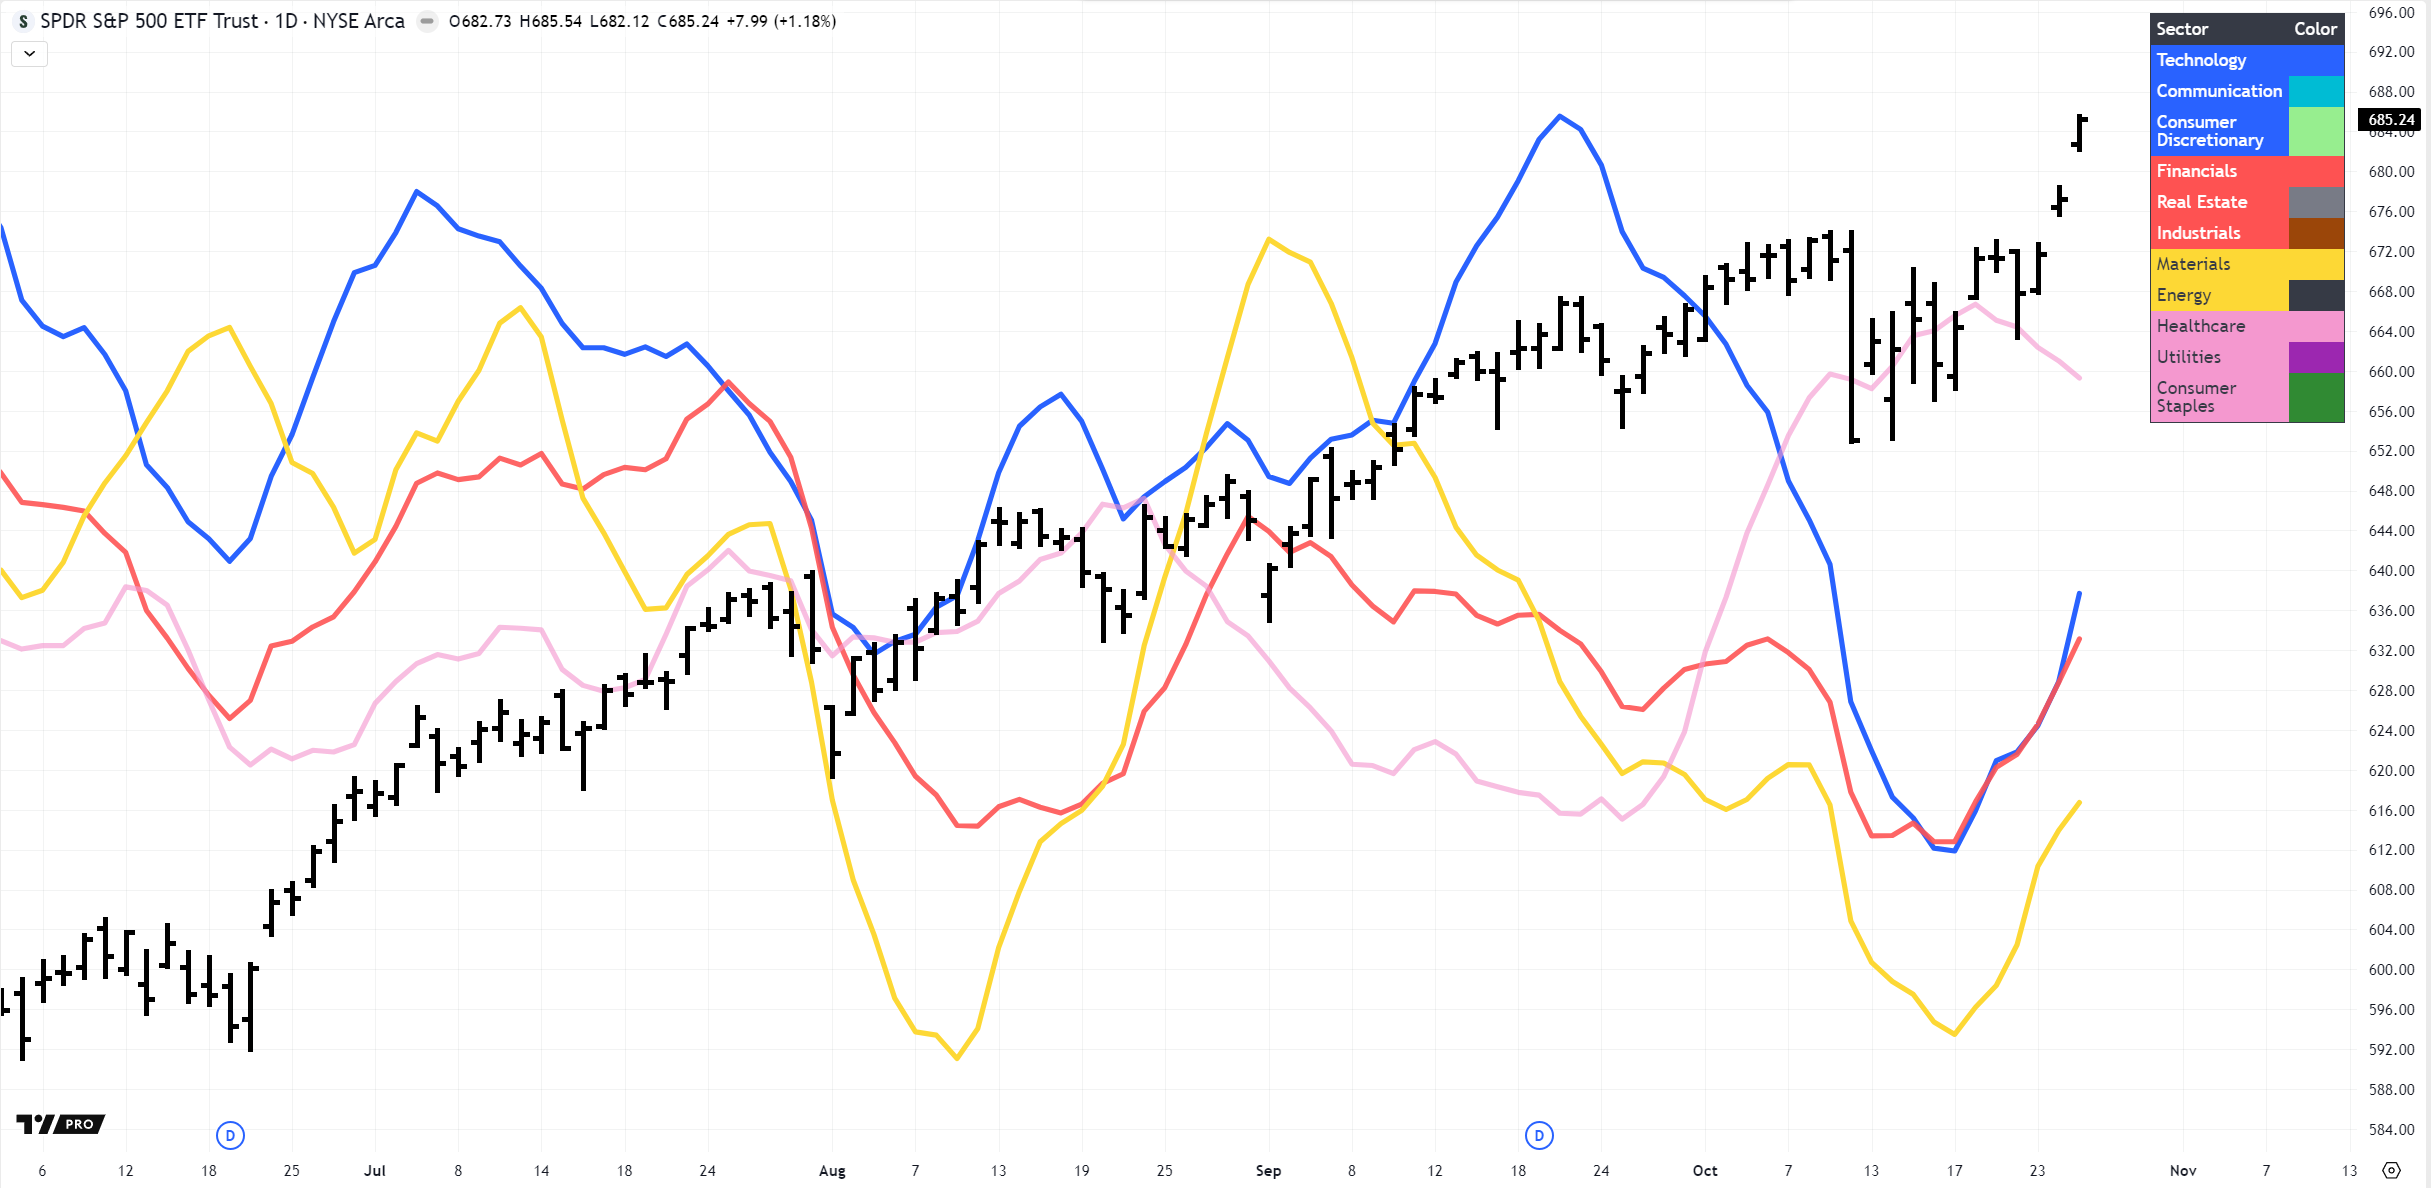 Despite exploding US government debt and the “cockroaches” crawling in the corners of the private-credit system (see our analysis on financing risk), the value sector — including financials — appears to have bottomed and is now ripping higher.
And yes, Big Tech is riding the circular money flows again, led by AMD.
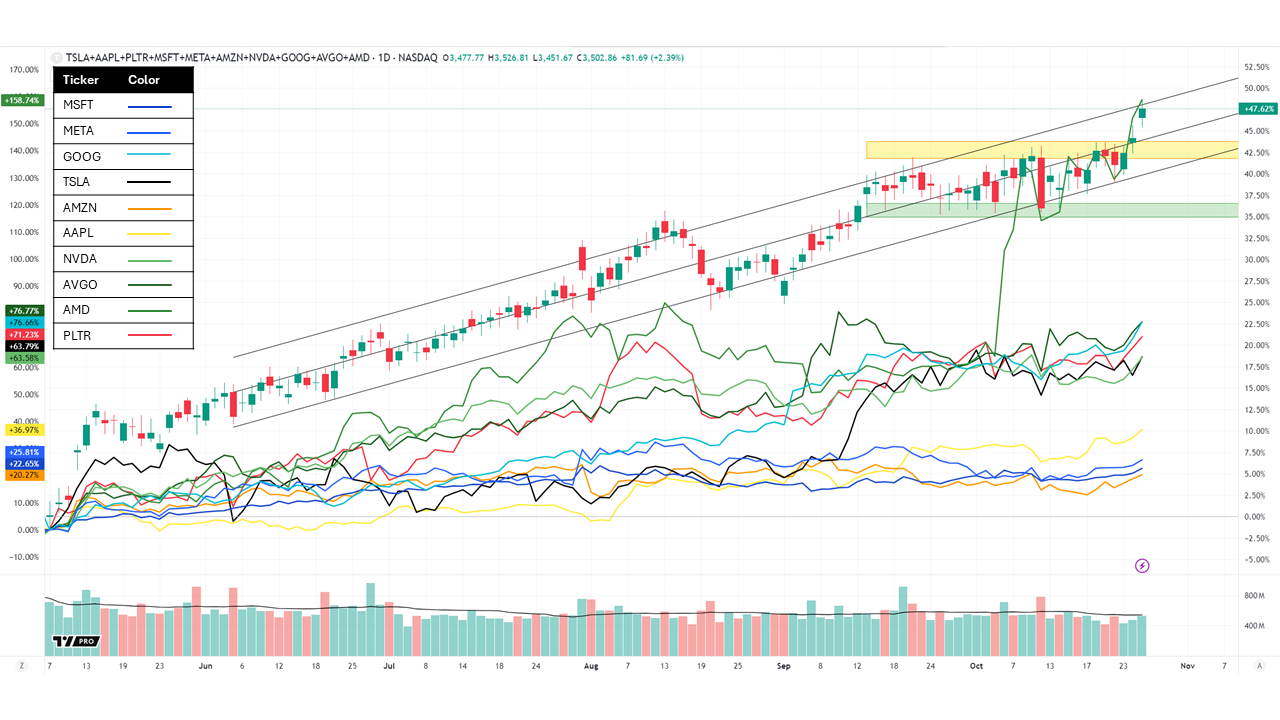 Who’s cousine was Lisa Su, the CEO of AMD again?
Defensives and Crude Oil
The long run-up in utilities peaked early last week and is now consolidating; healthcare and consumer staples seem to be topping out too. All signs point to risk-on.
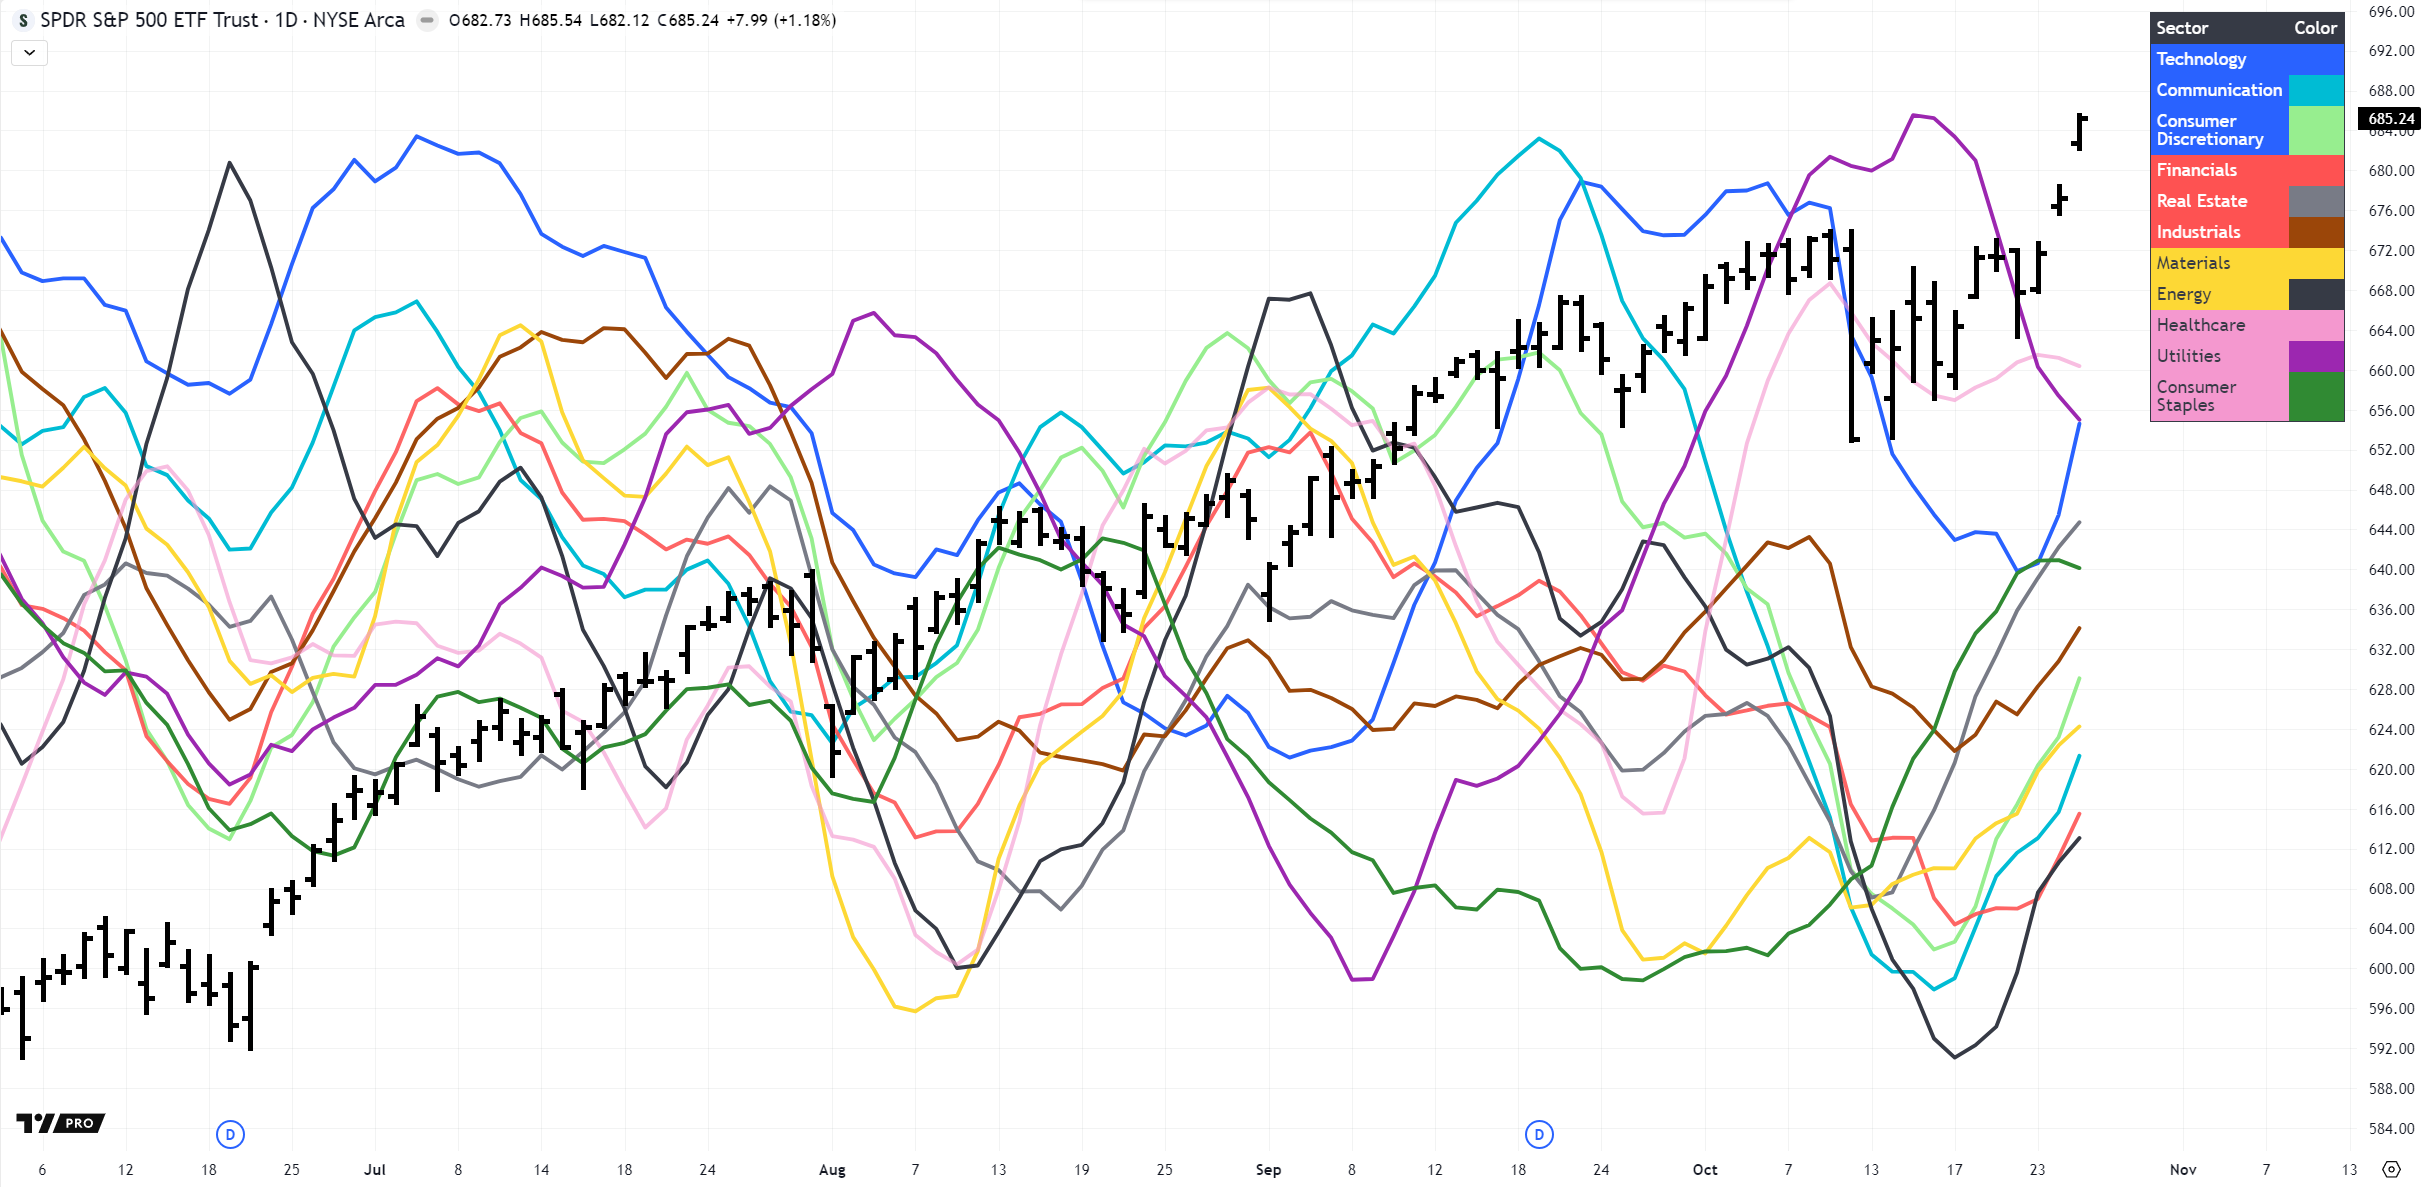
Defensives aren’t in free fall — just stuck in consolidation — which is one of the flaws in the goldilocks “everything is fine” narrative.
The other flaw? The dramatic turnaround in the energy sector: integrated oil companies, oil-field services, explorers and refiners are all seeing heavy inflows.
And no, that doesn’t square neatly with the notion of “just some toothless sanctions” on Russia’s Lukoil and Rosneft (Reuters).
What is the US oil industry prepping for? Why are insiders buying when OPEC+ is expected to raise production?
Ukraine’s successful strikes on Russian oil infrastructure are causing real supply disruptions, and even OPEC has hinted that announced production increases could quickly be reversed if global demand softens (FT).
Market Outlook – Earnings Above Expectations
The coming days will be packed with data and earnings that matter.
The Q3 earnings season in the United States has kicked off on a notably strong note. The latest from FactSet shows that 84% of S&P 500 companies reported revenues above estimates, which is above the 5-year average of 70%.
Year-over-year, corporate profits are tracking +9.2% growth, up from roughly +8% expected at the beginning of October — a solid acceleration.
In short: surprises are broad and healthy. Top-line strength is present. Technology, Financials and Materials are leading, while Energy and Health Care lag due to commodity and margin headwinds.
With earnings momentum running hotter than sentiment expected, the corporate sector is proving resilient — setting the stage for a potential year-end rally if the mega-cap results keep the current trend intact.
This Week’s Events and Market Drivers
| Day | Event | Expectations / Consensus | Market Reaction (S&P scenarios) |
|---|---|---|---|
| Mon Oct 27 | US Durable Goods Orders (Sep, prelim) | Mild growth in core capital goods (business capex stabilising but not booming) | 🟢 Bullish (+0.8 % to +1.5 %) → strong beat 🟡 Neutral (+0.0 % to +0.5 %) → in line 🔴 Bearish (-0.5 % to -1.2 %) → miss |
| Tue Oct 28 | Home Price Index (Aug) | Slight YoY deceleration in home-price gains | 🟢 Bullish (+0.8 % to +1.4 %) → cooling housing inflation 🟡 Neutral (0.0 % to +0.5 %) → flat 🔴 Bearish (-0.6 % to -1.3 %) → re-acceleration |
| Tue Oct 28 | Consumer Confidence (Oct) | Confidence expected to slip a bit owing to job/inflation concerns | 🟢 Bullish (+1.0 % to +2.0 %) → upside surprise 🟡 Neutral (0.0 % to +0.7 %) → near consensus 🔴 Bearish (-0.7 % to -1.5 %) → sharp drop |
| Tue Oct 28 | Microsoft Earnings (after close) | High bar: AI/cloud beat expected, strong results needed | 🟢 Bullish (+1.5 % to +3.0 %) → strong beat & upbeat guidance 🟡 Neutral (-0.2 % to +0.8 %) → mixed 🔴 Bearish (-1.0 % to -2.0 %) → miss or weak guidance |
| Tue Oct 28 | Alphabet Earnings (after close) | Strong ad revenue + AI/cloud story expected | 🟢 Bullish (+1.2 % to +2.5 %) → strong beat 🟡 Neutral (0.0 % to +0.7 %) → in line 🔴 Bearish (-0.8 % to -1.8 %) → ad slowdown |
| Wed Oct 29 | Fed Rate Decision (Oct 28-29 meeting) | Markets expect 25 bp cut, data-dependent language | 🟢 Bullish (+1.5 % to +3.0 %) → dovish cut + easing signal 🟡 Neutral (0.0 % to +0.5 %) → cut but cautious 🔴 Bearish (-1.0 % to -2.5 %) → hold or hawkish tone |
| Wed Oct 29 | Meta Earnings (after close) | Strong ad growth + spending discipline needed | 🟢 Bullish (+1.3 % to +2.5 %) → beat & cost control 🟡 Neutral (0.0 % to +0.6 %) → inline 🔴 Bearish (-0.8 % to -1.5 %) → miss or weak outlook |
| Thu Oct 30 | US Q3 GDP Advance (8:30 am ET) | 3% growth expected — “cool but not collapse” scenario | 🟢 Bullish (+1.0 % to +2.0 %) → 3% growth + tame inflation 🟡 Neutral (-0.5 % to +0.8 %) → stronger growth but inflation concern 🔴 Bearish (-1.0 % to -2.0 %) → <1% or negative surprise |
| Thu Oct 30 | Apple Earnings (after close) | Strong iPhone cycle + services + AI-ecosystem proof needed | 🟢 Bullish (+1.4 % to +2.8 %) → beat + upbeat guidance 🟡 Neutral (0.0 % to +0.6 %) → inline + cautious 🔴 Bearish (-1.0 % to -2.0 %) → miss or weak guidance |
| Thu Oct 30 | Amazon Earnings (after close) | AWS growth + retail margin watched | 🟢 Bullish (+1.2 % to +2.2 %) → AWS re-accelerates 🟡 Neutral (0.0 % to +0.7 %) → steady 🔴 Bearish (-0.8 % to -1.8 %) → AWS slowdown |
| Fri Oct 31 | Employment Cost / Wage pressure read-through (Q3) | Wage growth under watch; Fed needs evidence of easing | 🟢 Bullish (+0.8 % to +1.5 %) → wage growth cools 🟡 Neutral (0.0 % to +0.5 %) → in line 🔴 Bearish (-0.7 % to -1.4 %) → wage growth spikes |
| Fri Oct 31 | Exxon Mobil Earnings (after open) | Energy majors strong cash flow expected | 🟢 Bullish (+0.7 % to +1.4 %) → strong cash-flow + buybacks 🟡 Neutral (0.0 % to +0.5 %) → inline 🔴 Bearish (-0.8 % to -1.5 %) → weak downstream margins |
Final Thoughts
Keep an eye on the earlier described Megaphone-Pattern.
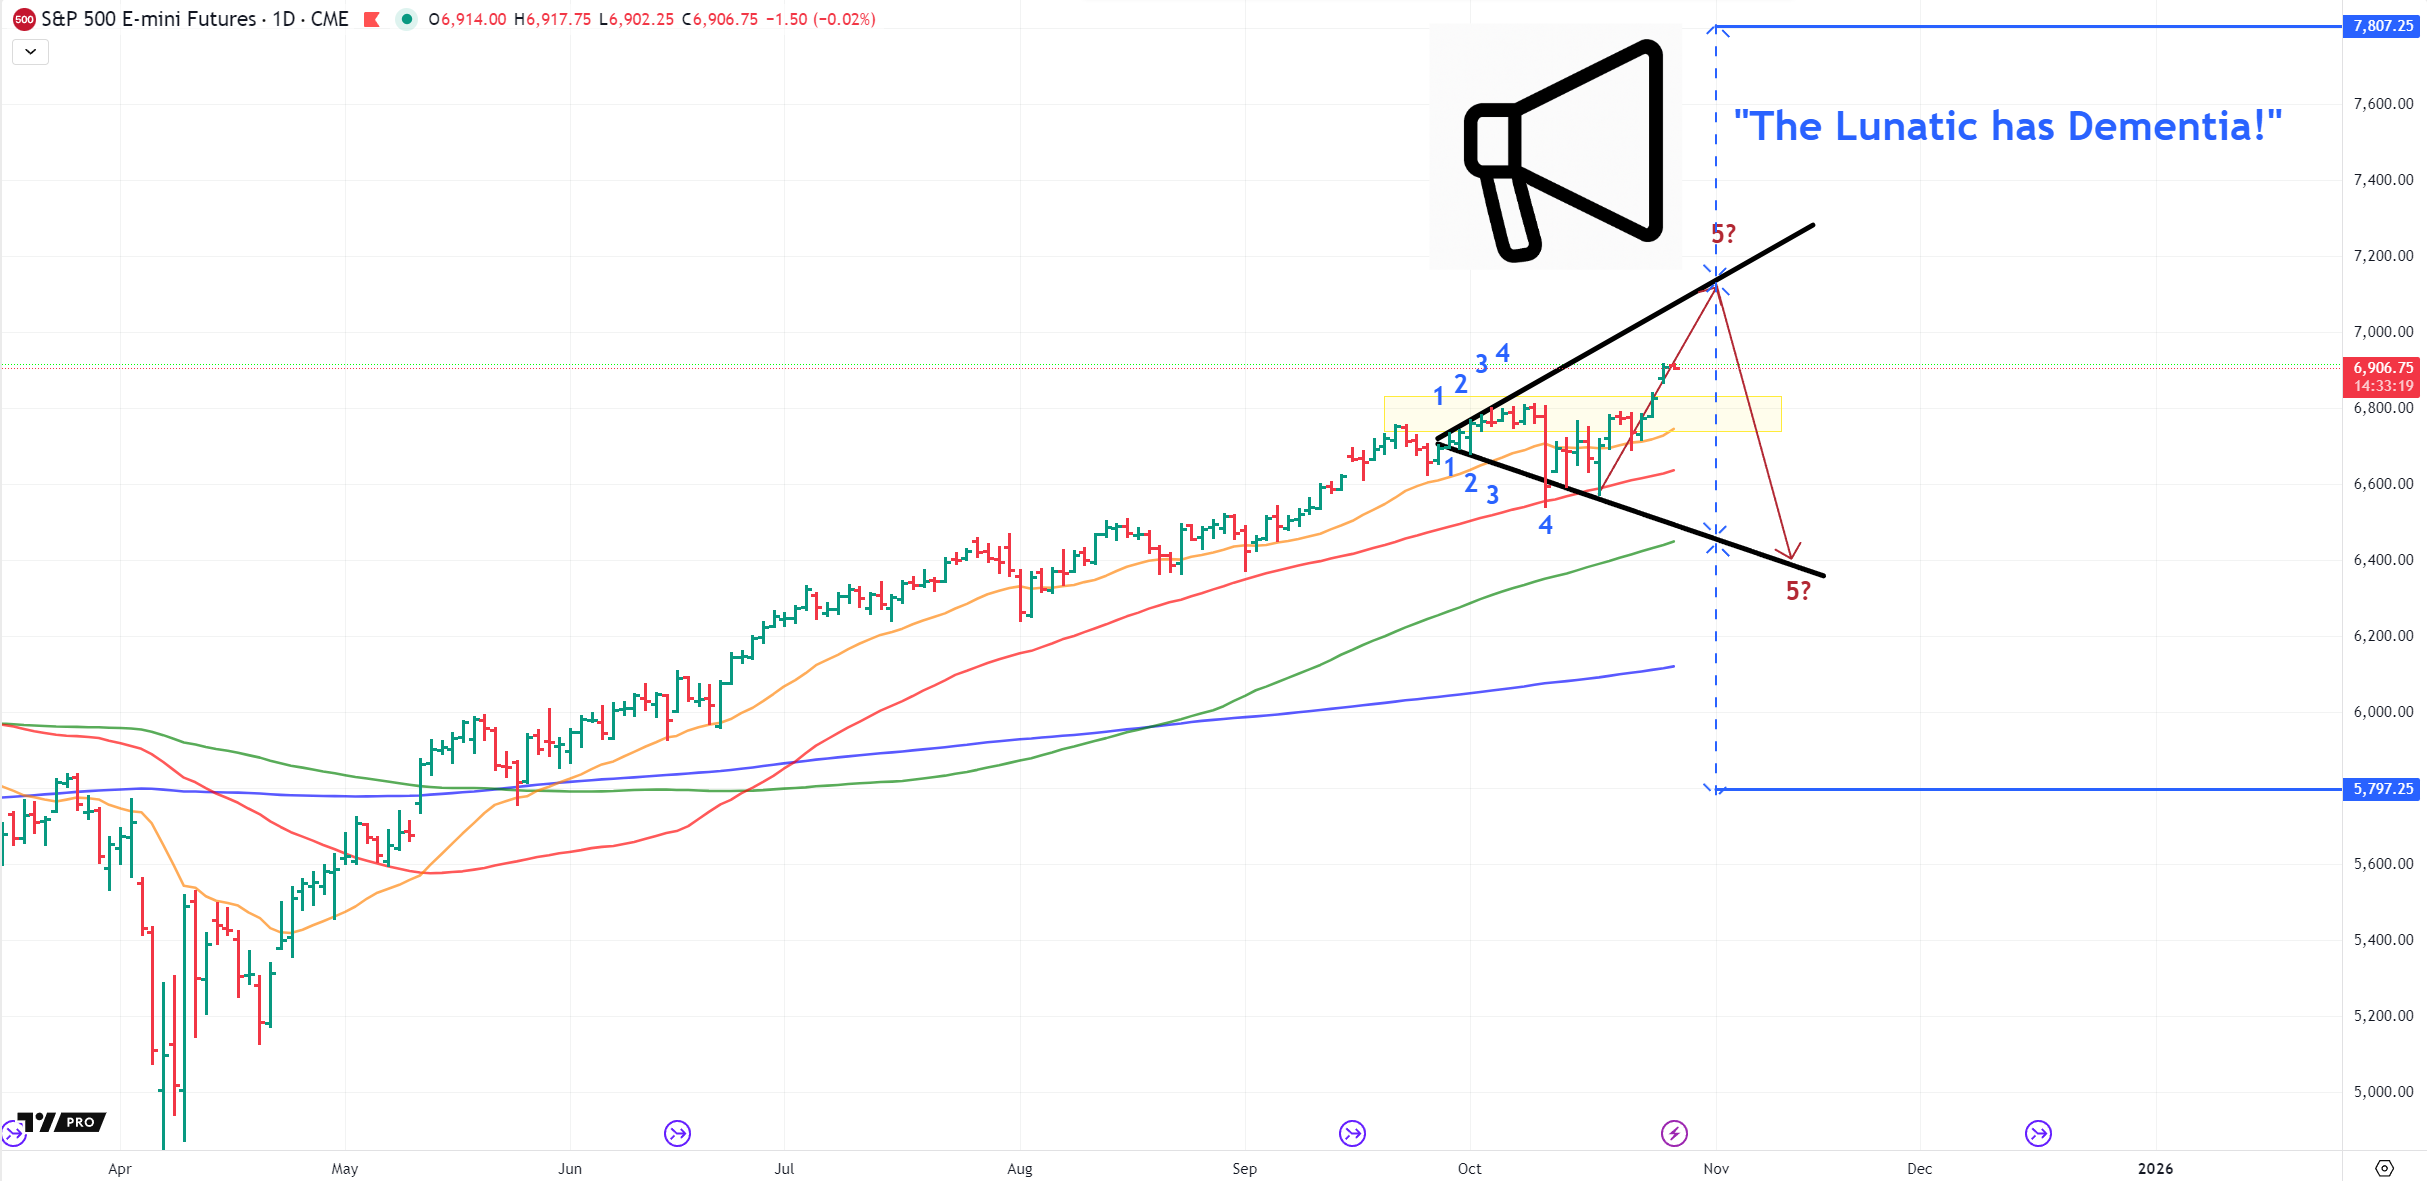
We continue to adjust the width of the pattern as the touches of the lower and upper trend-lines seem to drift farther apart. We may be approaching a fifth touch, projected in the 7,000–7,200 SPX range — and no one really wants to see a reversal there. Market partecipants are highly greedy and as irrational as markets themselves. They tend to ignore risks completely as long as no money can be made anymore. If the president is a risk-ignoring malignant narcissist, why should anybody behave differently to this new-normal?
Increasing volatility and wider ranges tend to follow that fifth touch, and if the pattern completes, it carries a surprisingly high hit rate: BEARISH