Market Analysis
The SP500 Indicator declined further, accompanied by a sharp sell-off in the S&P 500 itself. The U.S. equity market is clearly in a correction phase — a move that was not yet visible in the VIX or other common risk indicators.
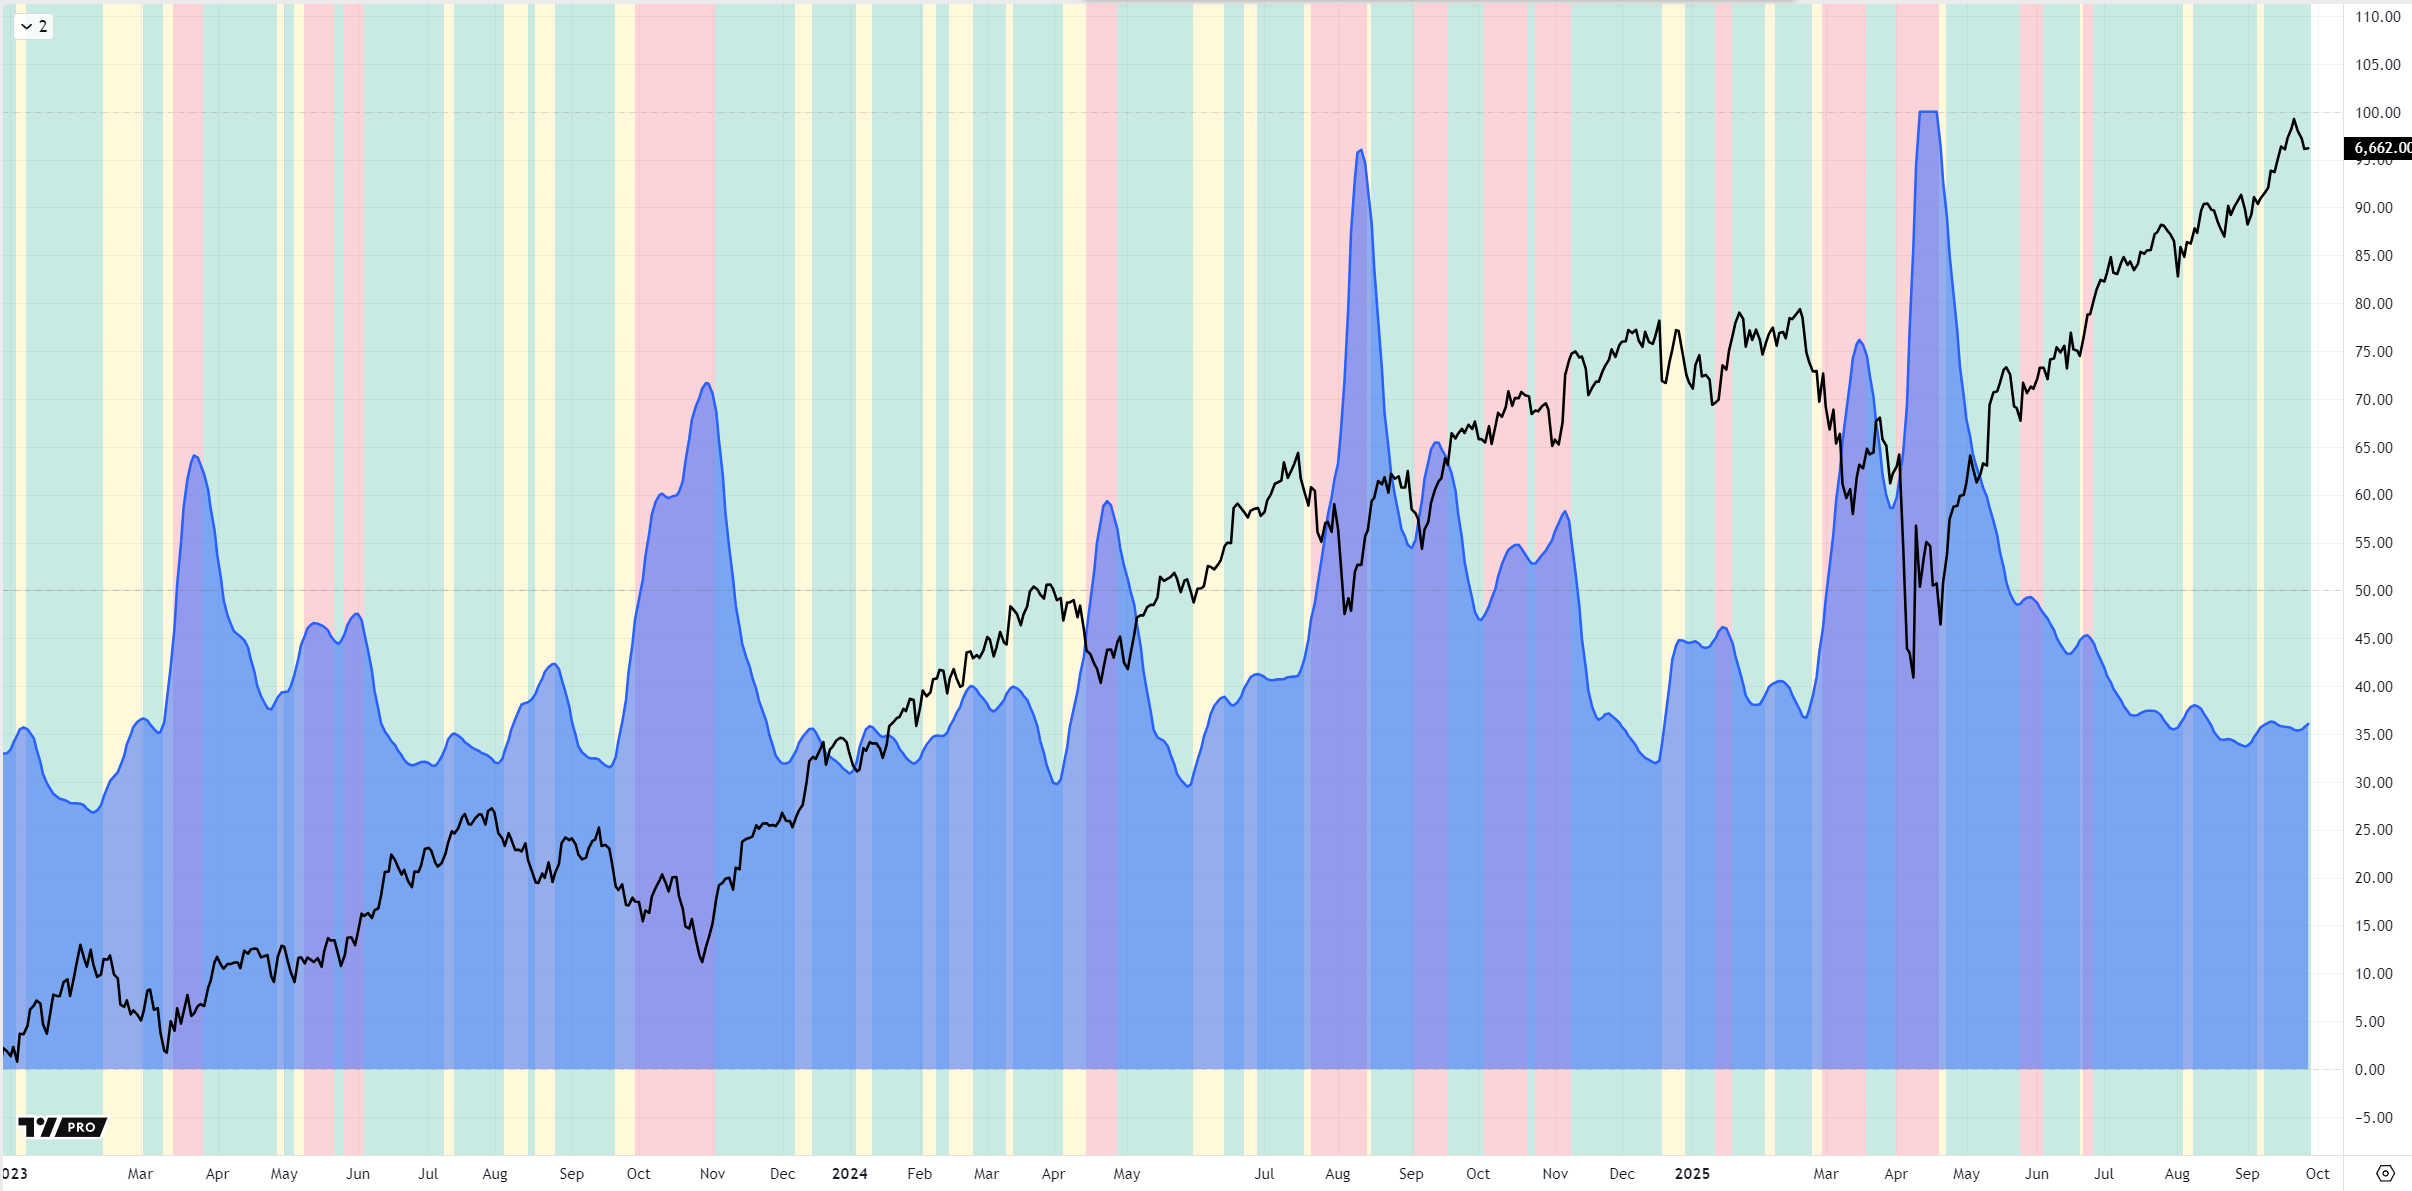
The Combined Risk indicator is based on common risk gauges, such as the VIX, the MOVE and credit spreads. Despite being extremely low and in decline for several weeks now, a recent uptick can be observed.
The decline was triggered, as hidden as it probably could, by heavy insider selling and unprecedented dark pool transactions.
The SP500 Indicator signaled the trend change correctly, well ahead of time.
Sector Rotation
A clear picture emerges, which shows that defensive sectors, such as Utilities and Energy dominate over all the other sectors. Notably even Materials is suffering allthough gold has revcently surged to a new ATH.
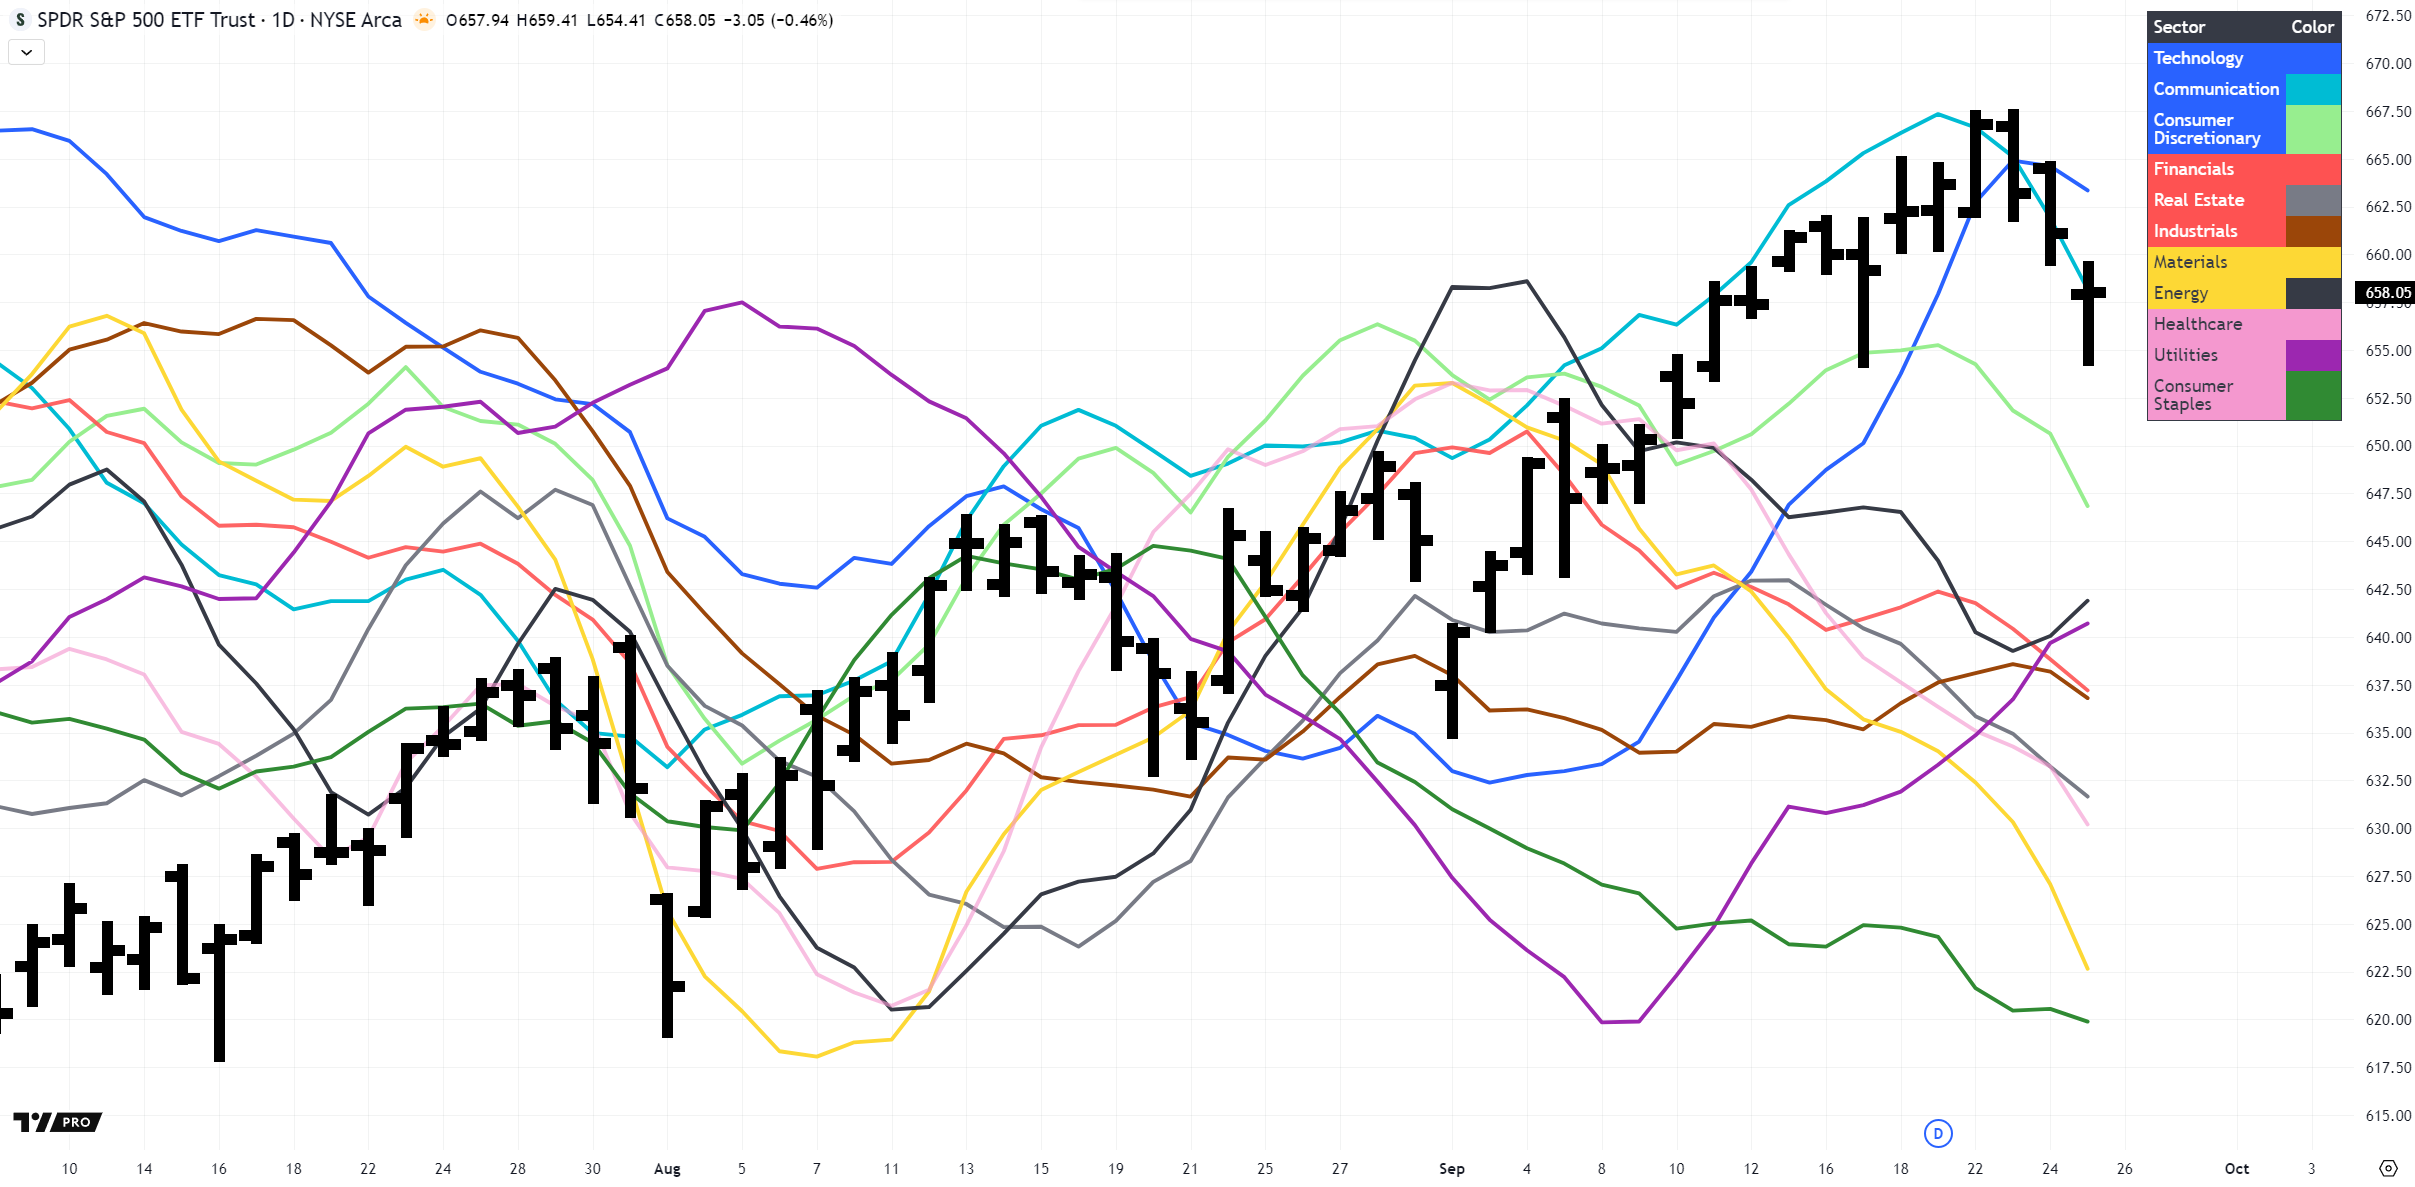
The Technology-Sector, which has predominantly driven up the latest leg in the S&P, is getting weaker, allthough the combined MAG10 index seems to be still in a stable uptrend.
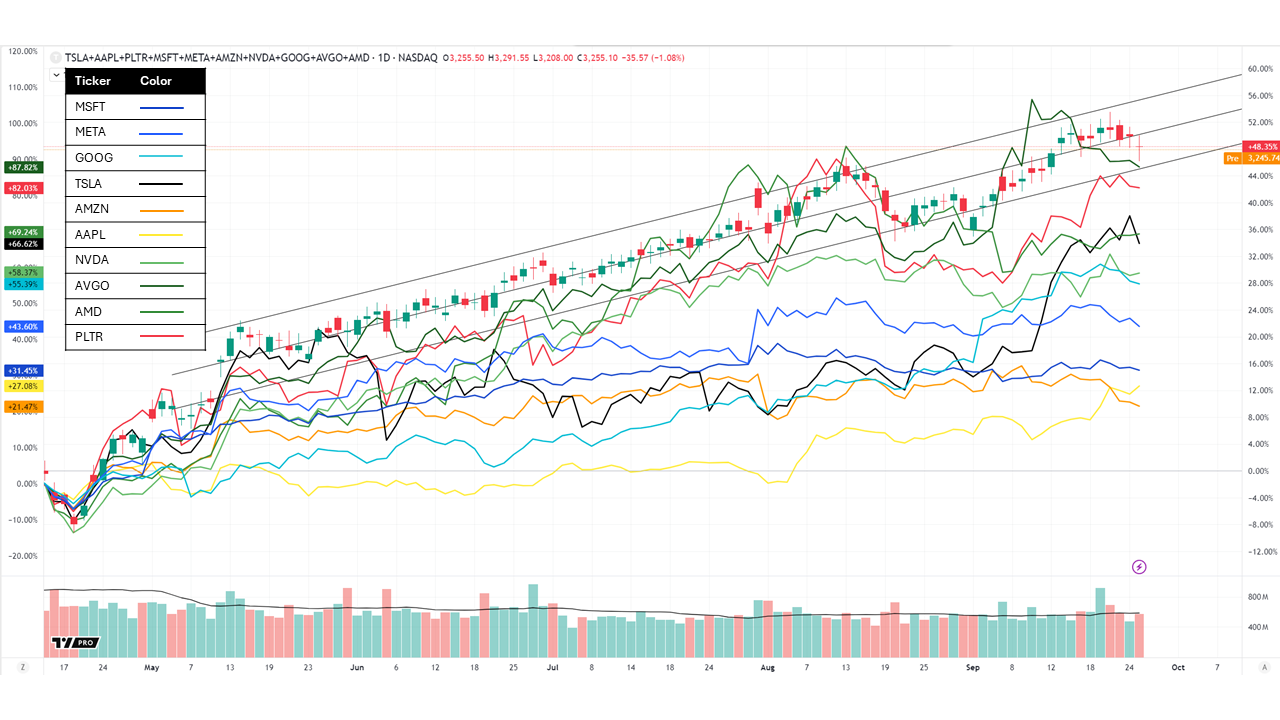
Could This be a great buying opportunity or a Shocktober?
Read the Market Outlook and keep following the SP500 Navigator. It provenly detects weakness and strenght ahead of time.
Strong GDP Data – Where Is the Flaw?
The third estimate of U.S. Q2 2025 GDP surprised to the upside:
- +3.8% annualized growth, revised from +3.3%.
- A sharp reversal from Q1, when GDP contracted by –0.6%.
Yet beneath the headline, the data reveal a story of imbalances, temporary boosts, and lingering uncertainties.
Breakdown of GDP Contributions (Q2 2025)
| Component | Contribution to GDP Growth (pp) | Direction |
|---|---|---|
| Private Consumption (PCE) | +1.7 | 🔼 Strong positive |
| – Durable Goods | +0.3 | Positive (autos, household equipment) |
| – Nondurable Goods | +0.2 | Moderate positive |
| – Services | +1.2 | Strongest driver (health, housing, recreation) |
| Government Spending & Investment | –0.01 | Neutral / slightly negative |
| Fixed Investment | –0.3 | Weak, especially residential construction |
| Net Exports | –0.2 | Negative, exports down |
| Change in Inventories | +0.6 | Positive swing, smaller drawdowns |
Takeaway: The entire expansion was carried by consumers, with only minor support from inventories. Investment and trade remain headwinds.
Private Consumption: The Driving Force
The U.S. consumer again acted as the growth engine, accounting for nearly half of the 3.8% expansion.
Services: The Core of Growth
- Healthcare: Rising demand, driven by demographics and insurance utilization.
- Housing & Utilities: Higher rental and service costs increased nominal outlays.
- Recreation & Travel: Summer demand for airlines, hotels, and leisure surged.
- Financial & Professional Services: Expanding advisory, software-as-a-service, and business services.
Services alone delivered +1.2 percentage points — more than any other GDP subcomponent.
Goods: More Volatile
- Durables (notably autos) rebounded, but much of it reflects discount-driven pull-forward demand.
- Nondurables (food, clothing, energy) contributed modestly, mainly due to price-adjusted volumes rather than strong real growth.
Pull-Forward Effects From Tariffs
A less visible but important factor: tariff front-loading.
- With new tariffs announced for later this year, both consumers and businesses rushed to import goods (cars, electronics, machinery) before higher duties took effect.
- This artificially boosted Q2 consumption and import volumes — a “buy now, worry later” effect.
- While imports mathematically subtract from GDP, the domestic spending side inflated retail and services demand.
Implication: Part of Q2’s consumer strength is likely borrowed from future quarters, raising the risk of a softer Q3/Q4 print.
Possible Sources of Error in GDP Data
Despite the upbeat headline, GDP data must be interpreted with caution:
- Revisions – Early estimates rely on incomplete surveys; inventories are often revised significantly.
- Inventories – Small changes in stockpiling can swing GDP by a full percentage point.
- Trade data lags – Export/import statistics arrive late and are often adjusted.
- Seasonal adjustments – Models may not fully account for post-pandemic distortions or tariff shifts.
- Deflator choice – Real GDP depends on price indexes; mismeasured inflation can distort growth.
- Temporary fiscal/tax effects – Refunds, rebates, or election-year incentives may skew consumption.
GDP Outlook
The consumer remains resilient, but the foundation looks fragile:
- Services demand appears sustainable, supported by demographics and labor income.
- Durables demand is likely temporary, inflated by tariff pull-forward.
- Investment and trade remain weak, leaving the economy vulnerable if consumption slows.
Bottom line: Q2’s 3.8% growth is impressive, but not necessarily repeatable. Investors should look beyond the headline and watch whether services momentum can withstand higher tariffs, slower job growth, and the unwind of front-loaded spending.
Market Outlook
With major indices approaching the Daily MA20, initial support is forming: the NQ and the ES already show signs of a potential bullish counter-move within the bearish trend. Expect a retest of 6,700 (ES) and 24,800 (NQ). Price action at these levels will determine the next leg.
Personal Consumption Expenditures (PCE) – Today’s Key Data Release
All eyes are on today’s PCE and Core PCE inflation release, the Federal Reserve’s preferred gauge of underlying price pressures.
Market Expectations
- Core PCE (ex food & energy): +0.2% MoM, 2.9% YoY
- Headline PCE: +0.2–0.3% MoM, 2.7% YoY
- Compared with July’s +0.27% MoM core reading, consensus looks for modest cooling.
Why It Matters
- The PCE deflator shapes Fed policy decisions more directly than CPI.
- A softer number would support rate-cut expectations, while a stronger print would revive hawkish repricing.
Market Scenarios for the S&P 500
| Signal | Scenario | PCE Outcome | Expected S&P 500 Reaction | Implications |
|---|---|---|---|---|
| 🟢 | Bullish | Core PCE < 0.2% MoM or < 2.8% YoY | S&P +1–2% | Dovish Fed narrative, yields ease, growth stocks outperform |
| 🟡 | Neutral | Core PCE in line with expectations (0.2% MoM, 2.9% YoY) | Flat / ±0.5% | Market consolidates, focus shifts to next Fed meeting |
| 🔴 | Bearish | Core PCE > 0.3% MoM or > 3.0% YoY | S&P –1–2% | Sticky inflation fears, yields rise, Fed tightening bias re-priced |
Takeaway
PCE remains the single most important near-term data point for U.S. risk assets. The balance between a resilient consumer and the Fed’s tolerance for inflation overshoots will determine whether today’s release is interpreted as confirmation of a soft-landing narrative or a renewed inflation scare.