Market Analysis
The S&P 500 Indicator lost momentum but remains in positive territory. The sell-off was sharper than expected, breaking below the weak 6400 level before reversing at the stronger 6350 zone, which also coincides with the Daily MA50.
The most concerning aspect of market structure is the emerging Distribution, observed yesterday. Combined with September’s seasonal weakness, this raises the risk of a decline toward 6250 or even the cluster of support zones near 6000 — the first target of the Ending Diagonal pattern described in yesterday’s Blog.
Before deeper selling materializes, however, a retest of the 6500 sell zone is plausible, leaving the ultra short-term outlook bullish until proven otherwise by price action.
Reasons for Yesterday’s Volatile Session
The S&P 500 opened with a sharp sell-off, followed by a strong recovery later in the day.
Morning: Sell-off Drivers
- Rising Treasury Yields pressured equities as concerns over fiscal deficits and possible political influence on the Federal Reserve mounted.
As previously highlighted, the yield spreads show an unusual pattern:
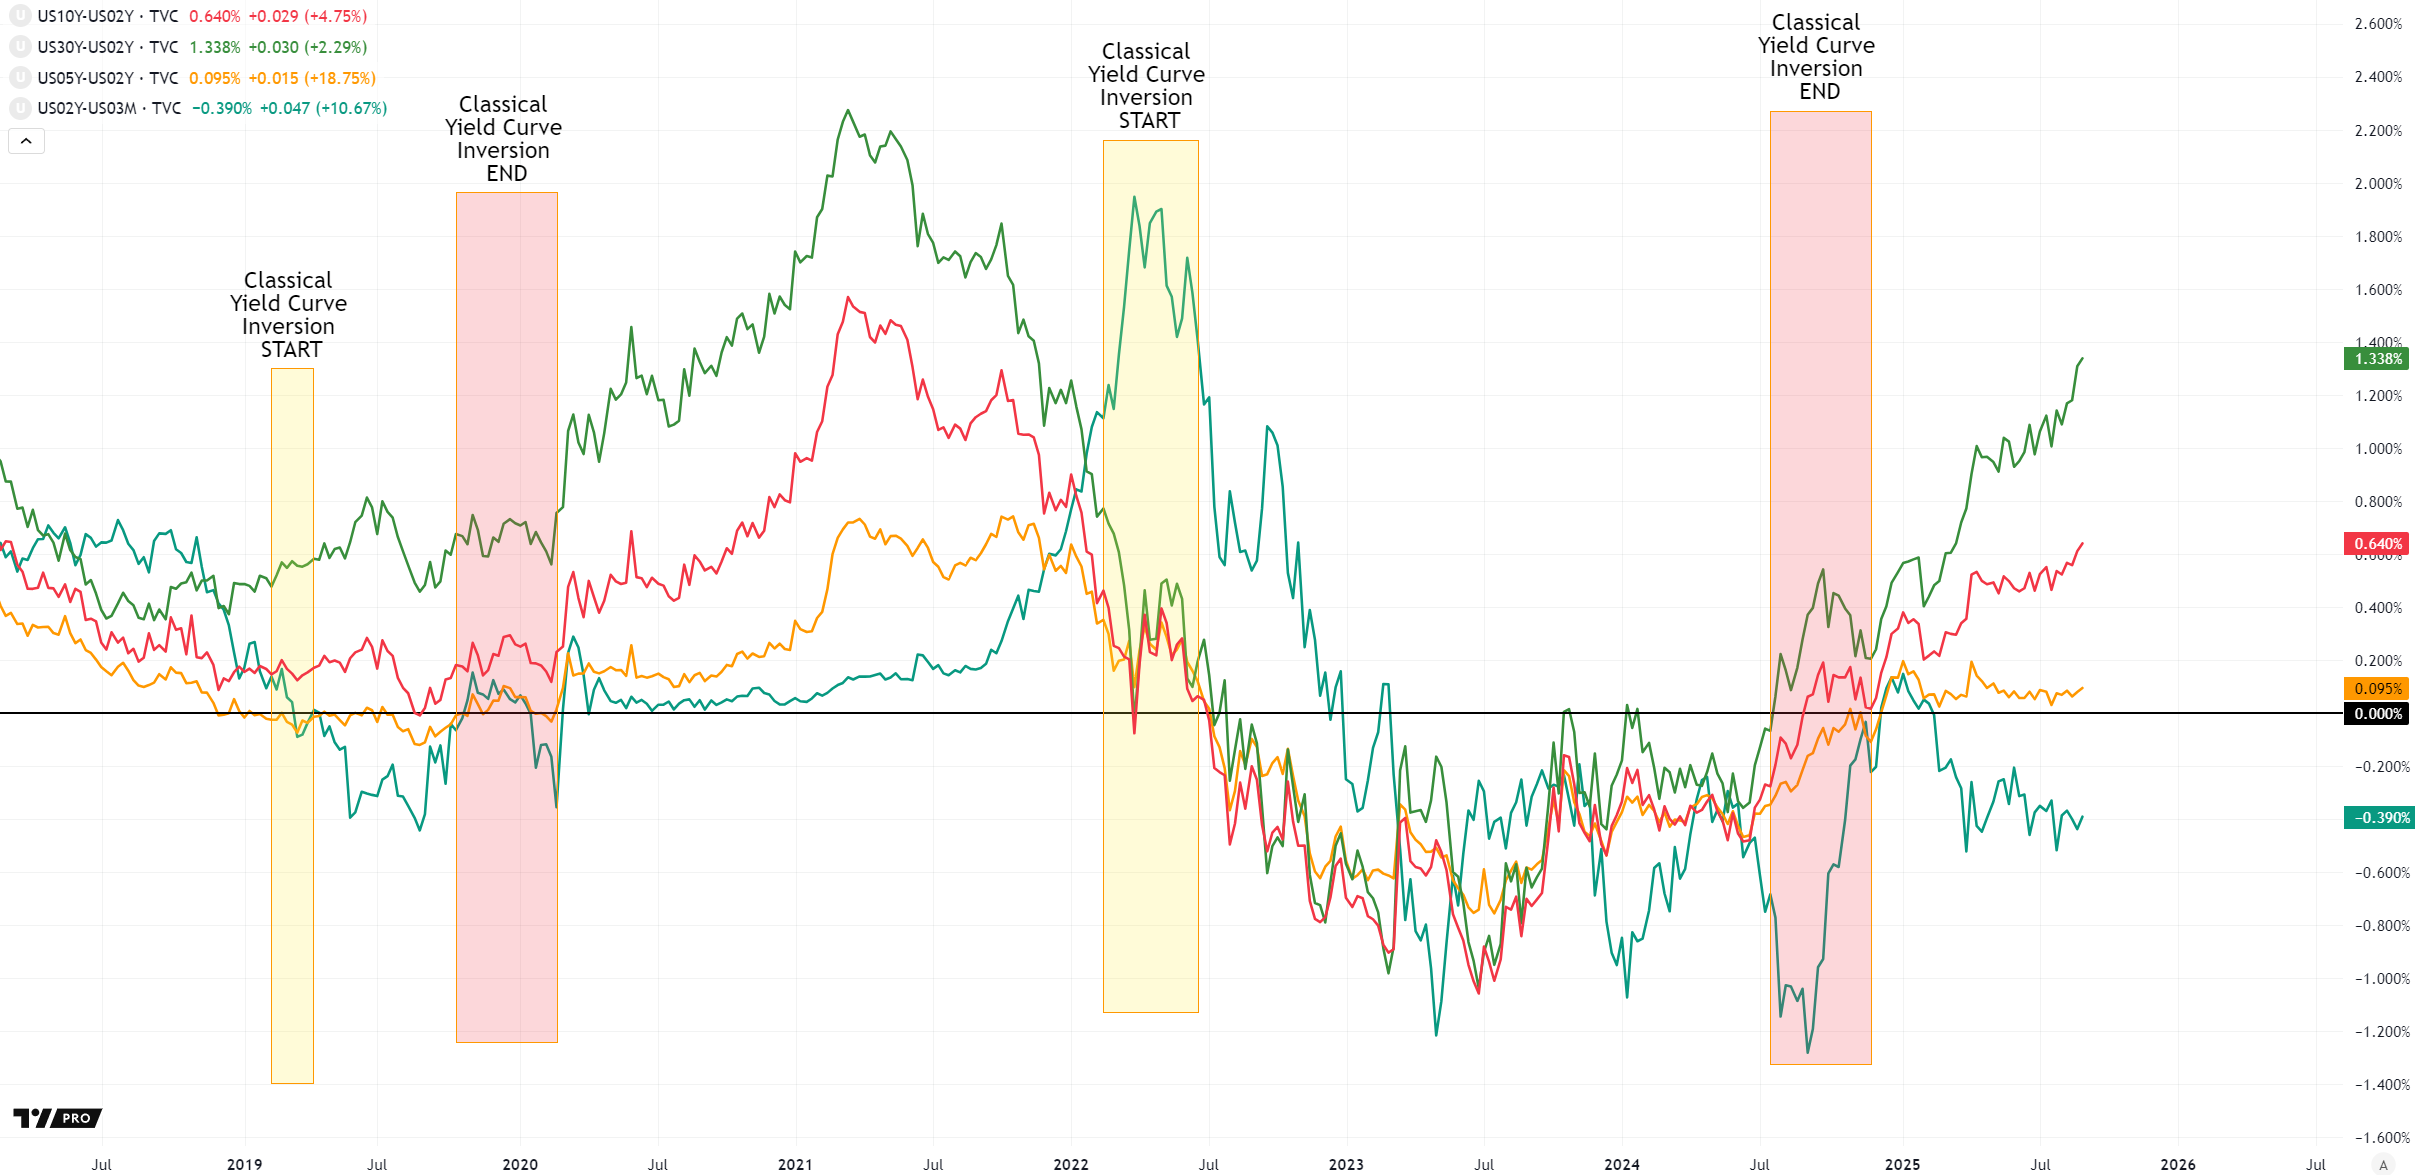
While shorter maturities (2Y–3M) remain inverted, the long end (30Y–2Y) is steepening as risk premia are not decreasing. Contrary to popular belief — and misinterpretation by President Trump — Fed rate cuts have no direct impact on long-term Treasury yields, which are determined by market risk perceptions. - Trade Policy Uncertainty escalated after a U.S. appeals court struck down parts of Trump’s tariff program, fueling fiscal concerns.
- Tech Weakness saw Nvidia, Apple, and Amazon lead declines.
- Flight-to-Safety flows pushed gold to record highs.
- Political Uncertainty deepened as Trump’s temporary disappearance raised speculation about his health and possible succession risks.
Afternoon: Rally Catalysts
- Trump Reappearance: Markets calmed as Trump reappeared at a press conference, alleviating fears of a leadership vacuum.
- Tech Relief: A federal ruling in the Google antitrust case boosted Alphabet and Apple, sparking a rebound in growth stocks.
- Sector Strength: Gold miners, biotech, and aerospace supported the recovery.
- Technical Support: Buying emerged near key support zones (6,200), reversing the morning’s decline.
Overall, the day reflected a tug-of-war between macro headwinds (yields, politics, trade) and stock-specific relief rallies.
Source: Reuters – Investors on edge as September reset exposes simmering US market risks
Sector Rotation
The relief rally, led by Technology, is clearly visible in the Sector Rotation charts:
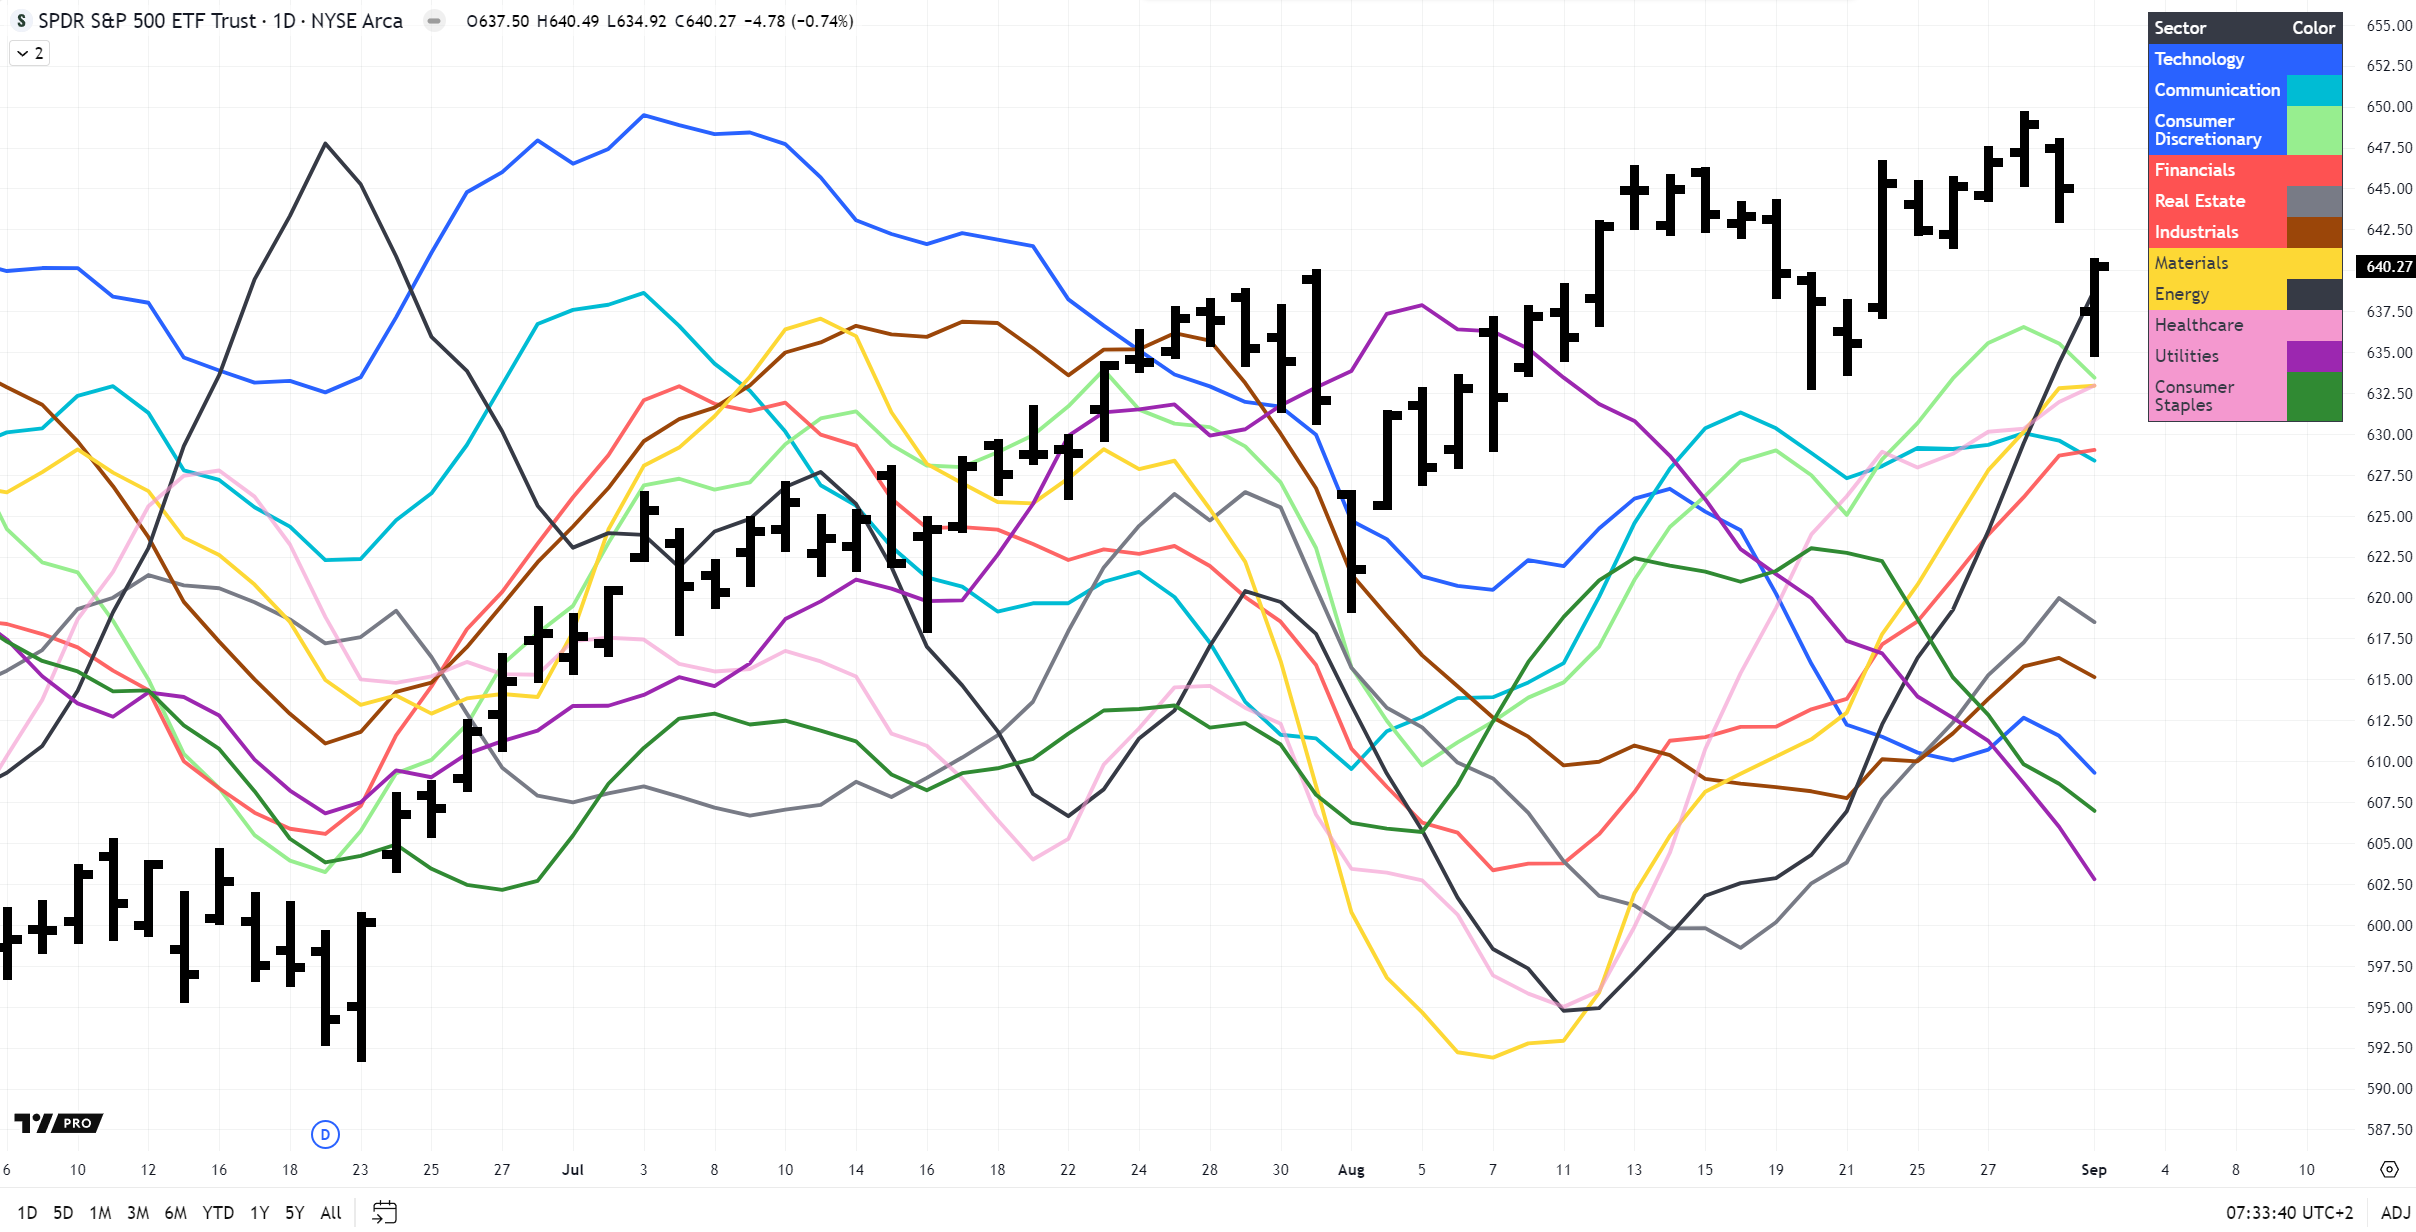
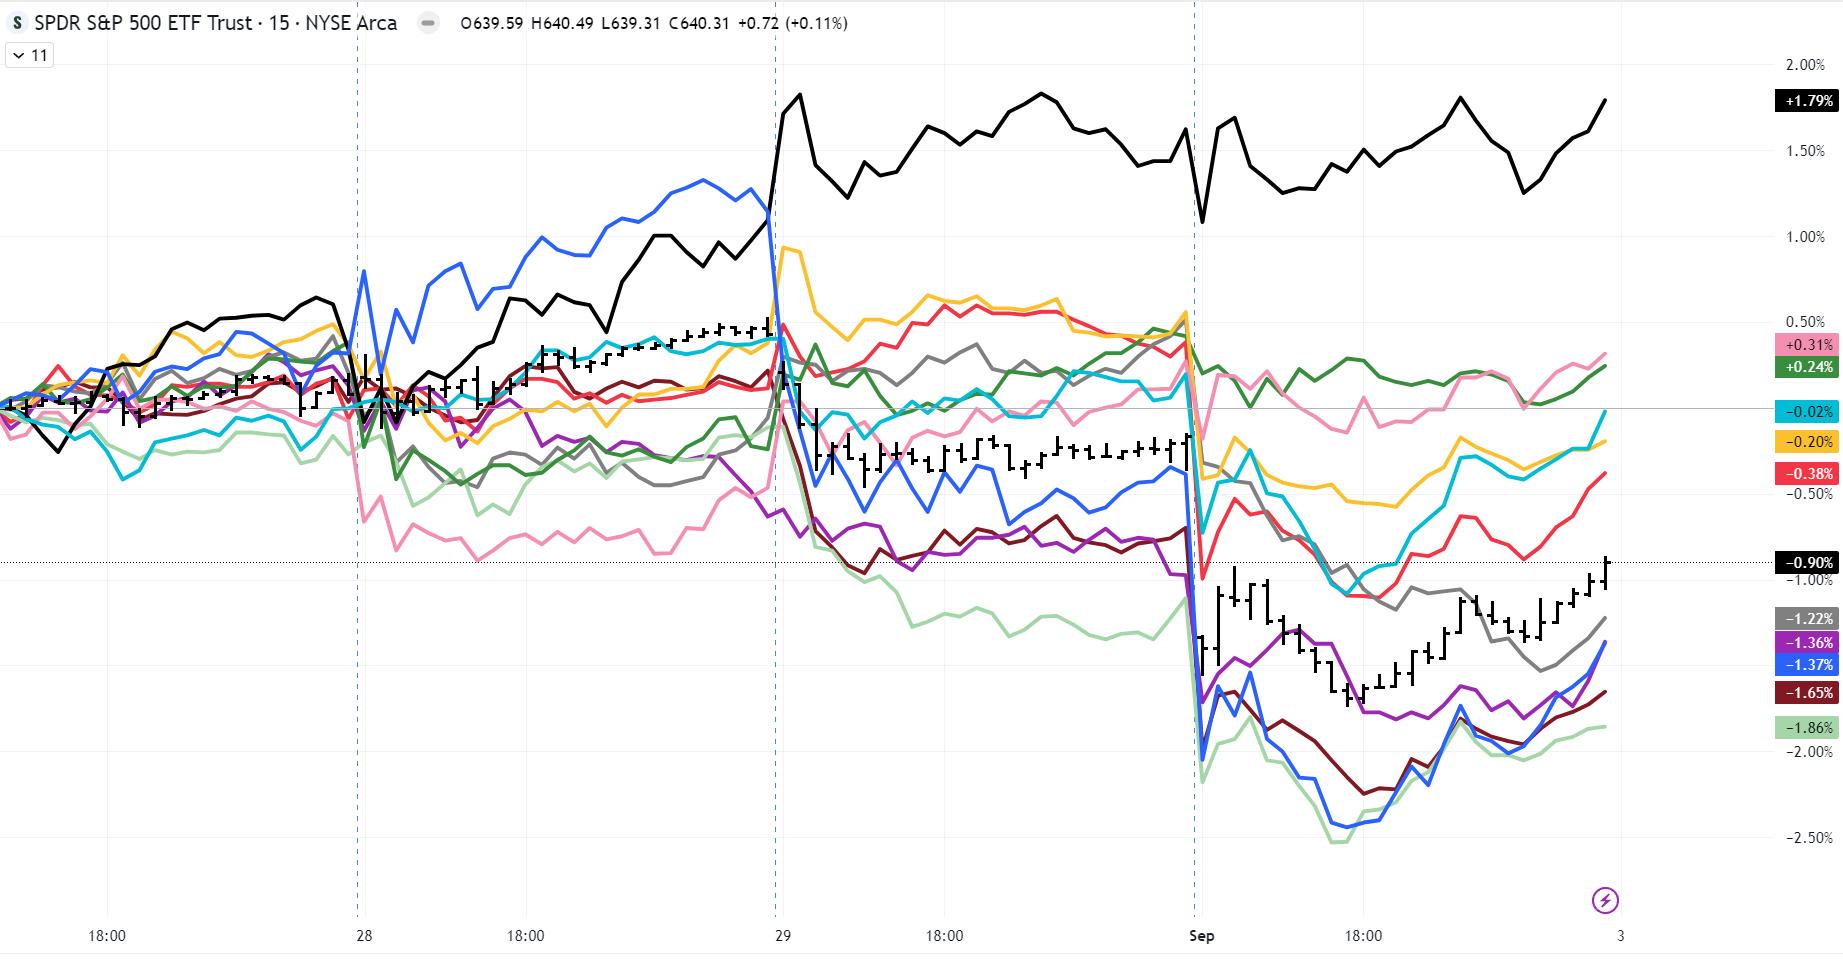
The Energy sector stands out as the strongest performer. Historically, Energy leadership often signals a topping phase, preceding broader market corrections. Crude Light (CL futures) has clearly shifted back to the bullish side.
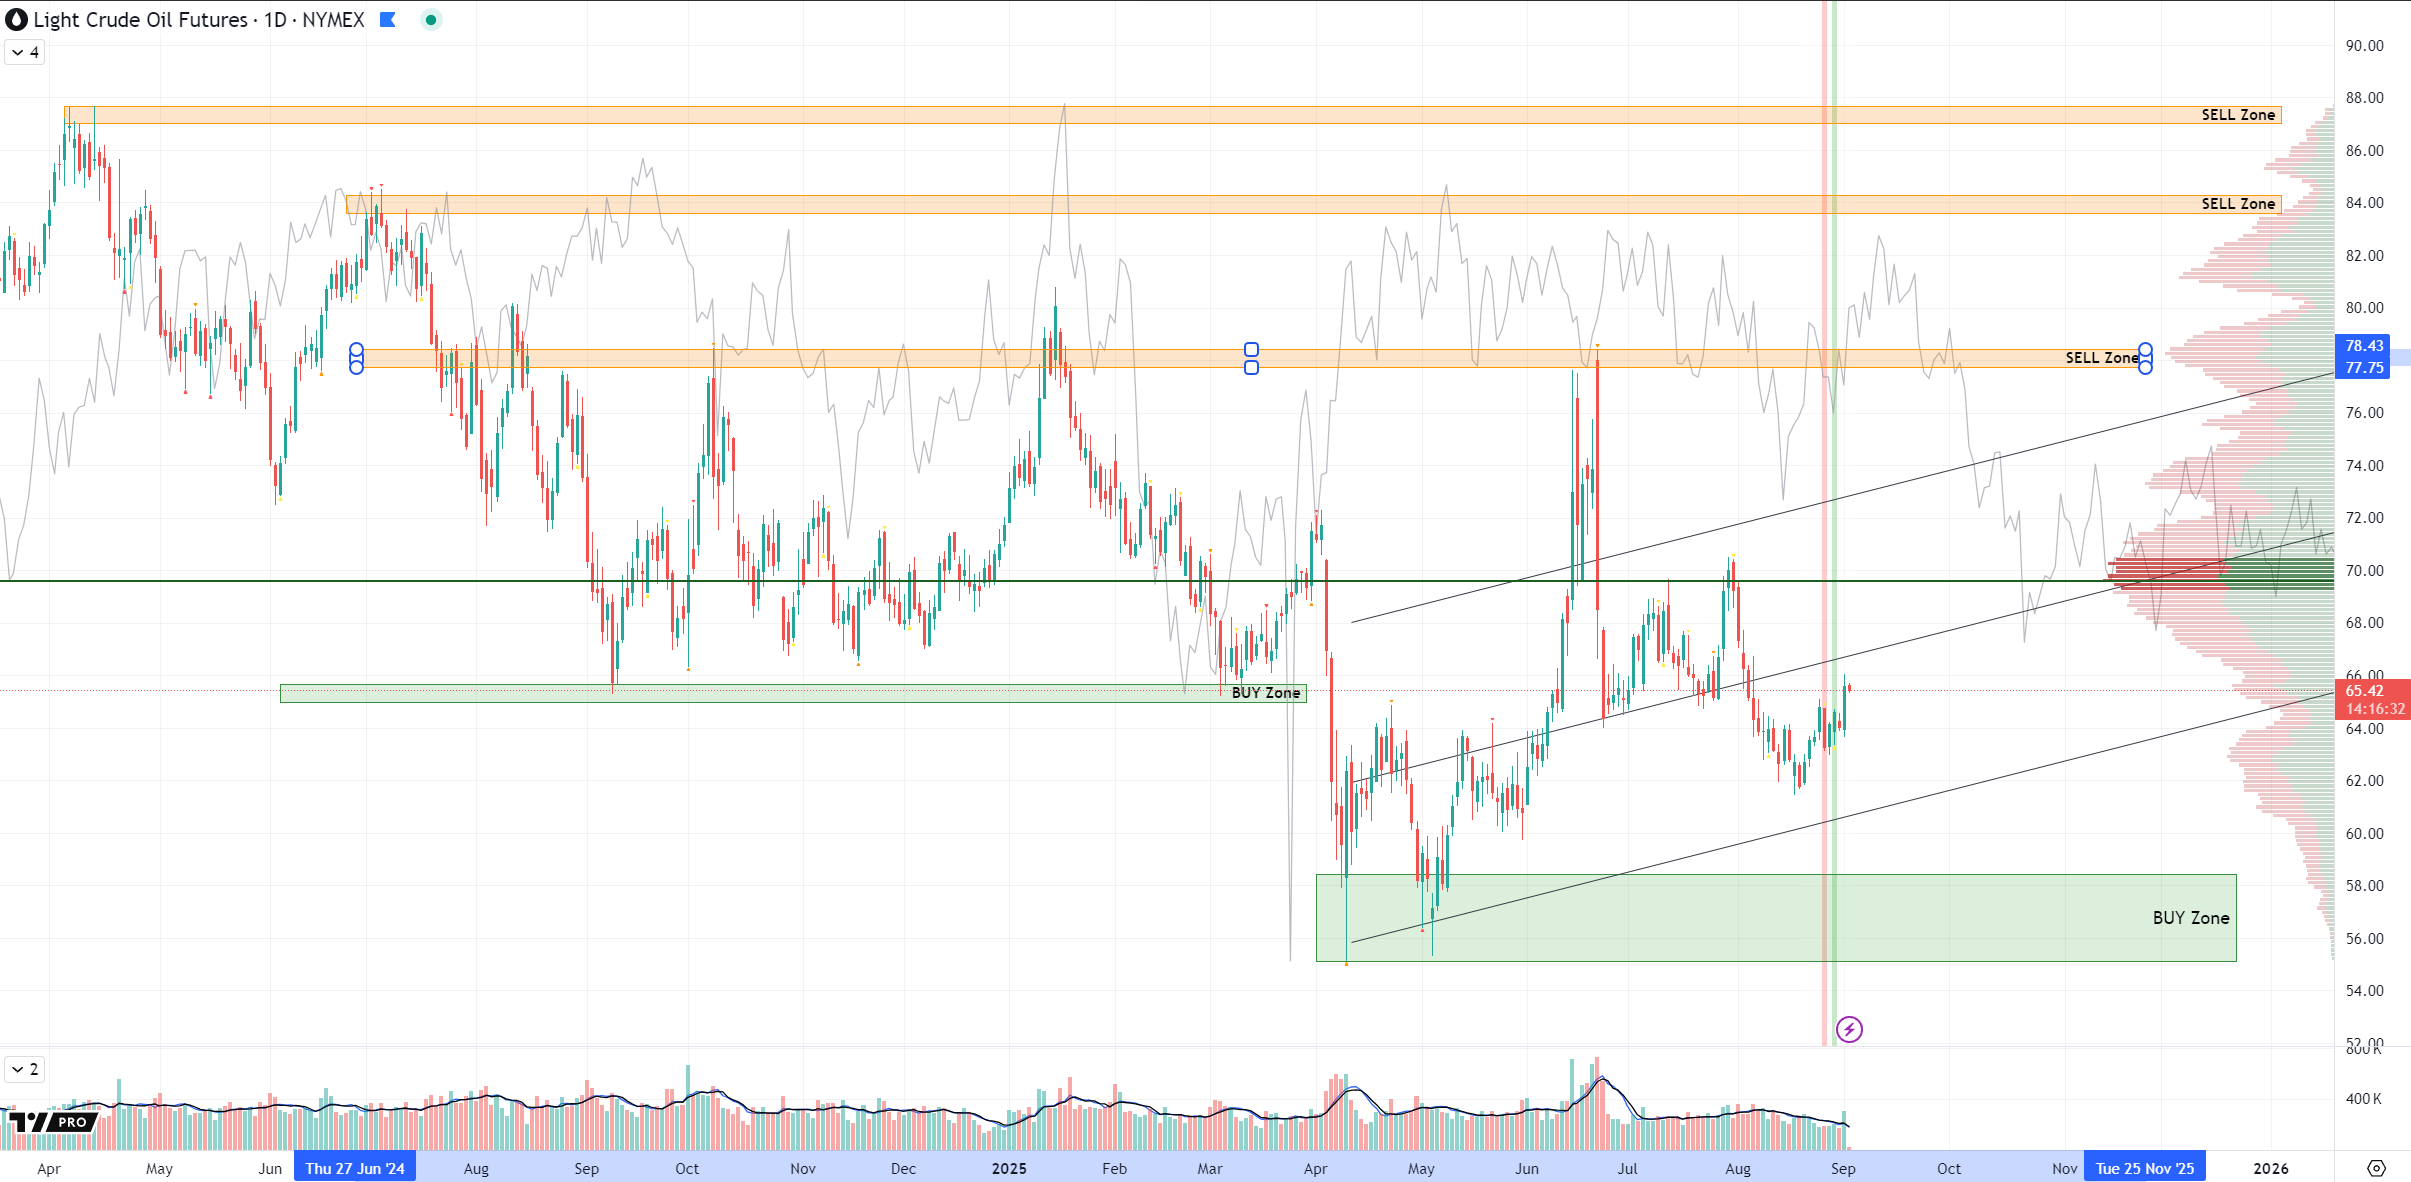
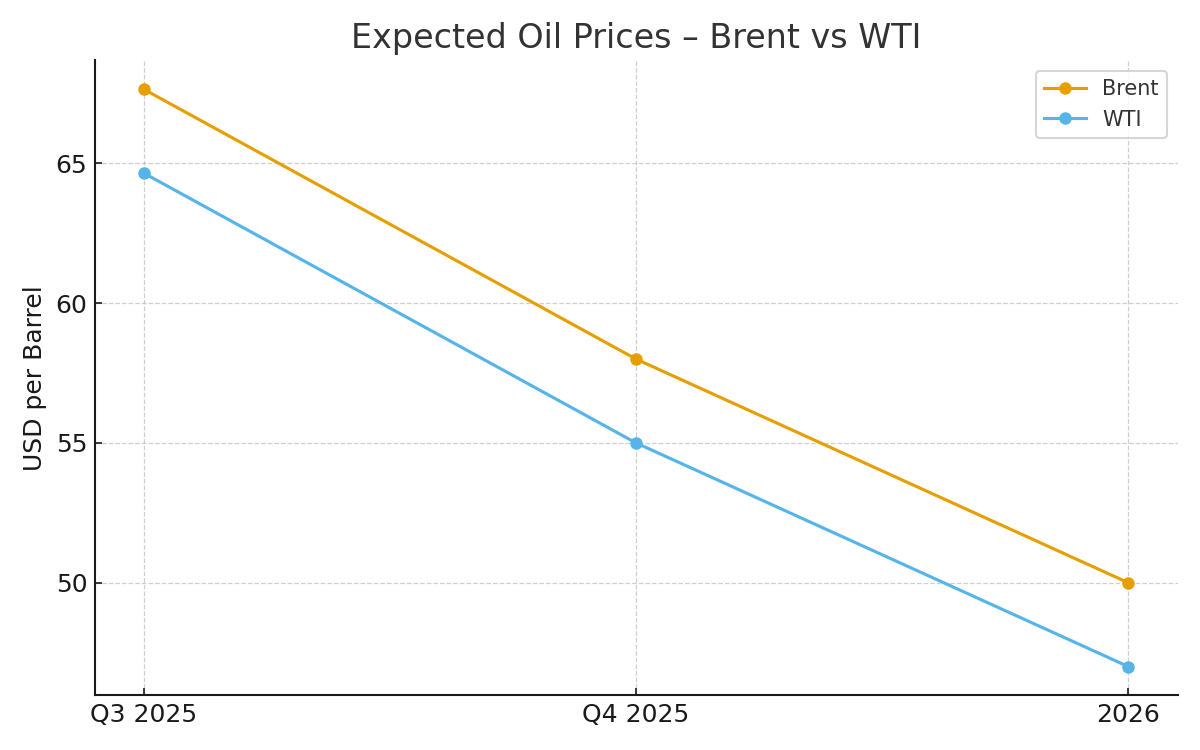
From a technical perspective, a rally back to the most traded zone around USD 70 is plausible. The current EIA-Short-Term Energy Outlook (STEO) projects Brent to average USD 58 per barrel in Q4 2025 and drift toward USD 50 in 2026, even as U.S. output reaches a record 13.6 mbpd by year-end 2025. Distillate inventories are forecast to end 2025 at their lowest level since 2000, reflecting strong exports and tighter product balances, while natural gas prices (Henry Hub) are expected to rise from USD 3.20 in July to nearly USD 3.90 in Q4 2025 and USD 4.30 in 2026.
Short-term dynamics remain driven by inventory swings. Analysts expect another 3.4 million barrel crude draw for the week ending August 29, following a 2.4 million barrel decline the week before. The Reuters outlook notes that with the end of the U.S. summer driving season, demand is likely to soften, while the upcoming OPEC+ meeting on September 7 is not expected to bring any production cuts. A recent Reuters poll places 2025 averages at USD 67.65 for Brent and USD 64.65 for WTI, but highlights growing concerns about a supply glut as OPEC+ adds more than 500,000 bpd from September onward.
Sector Quick Take: Short-term strength in Technology within a mid-to-long-term topping phase dominated by Energy. The divergence between cyclical Tech momentum and structural Energy leadership suggests increasing cross-sector volatility, often a hallmark of late-cycle markets.
Market Outlook
Base case: a short-term rally, primarily in Tech, to retest the 6500 sell zone. From there, market action will reveal direction. A deeper correction remains possible given weak September seasonality and mounting macroeconomic risks. The precise trigger for yesterday’s sell-off remains elusive. None of the commonly cited explanations appear fully convincing on their own — but taken together, they may have provided sufficient weight to unsettle markets. The most plausible interpretation is that equities are entering a late-cycle phase, with capital rotation away from Technology and into more defensive or cyclical areas, compounded by seasonal weakness in September. In such an environment, virtually any piece of negative news can serve as a convenient catalyst for selling pressure.