Markov Regime Analysis
Probabilistic market regime detection using Hidden Markov Models
This is the market weather forecast. By characterizing the most recent market regimes, the Markov Model determines the likelihood of regime transitions — providing a probabilistic outlook for future price action.
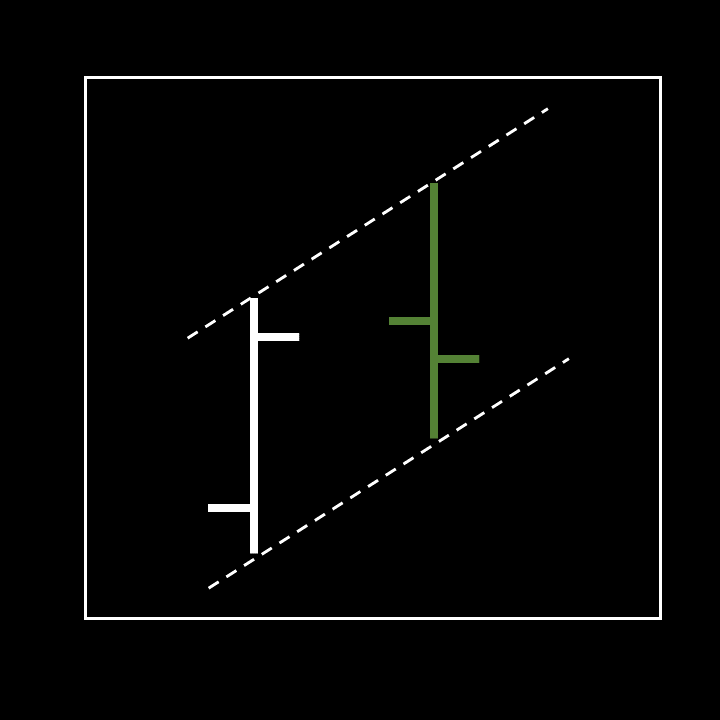
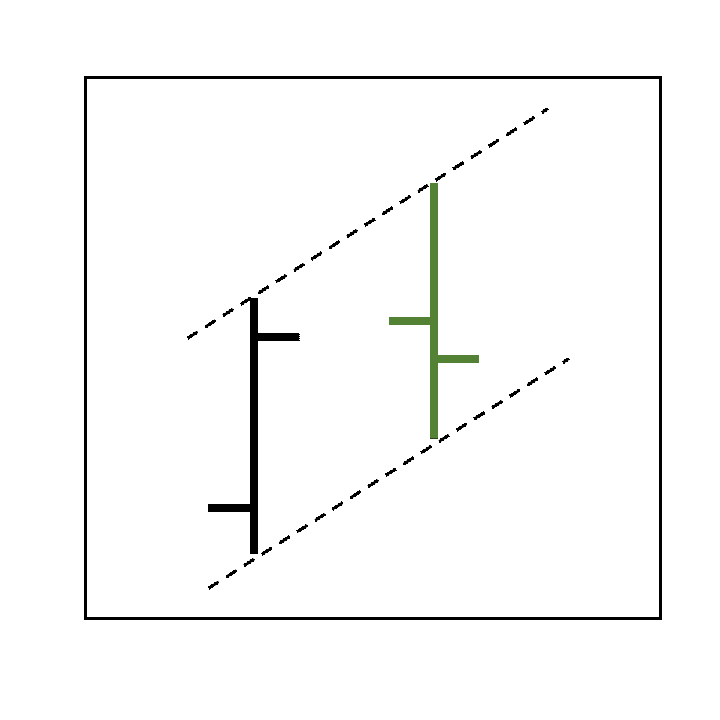
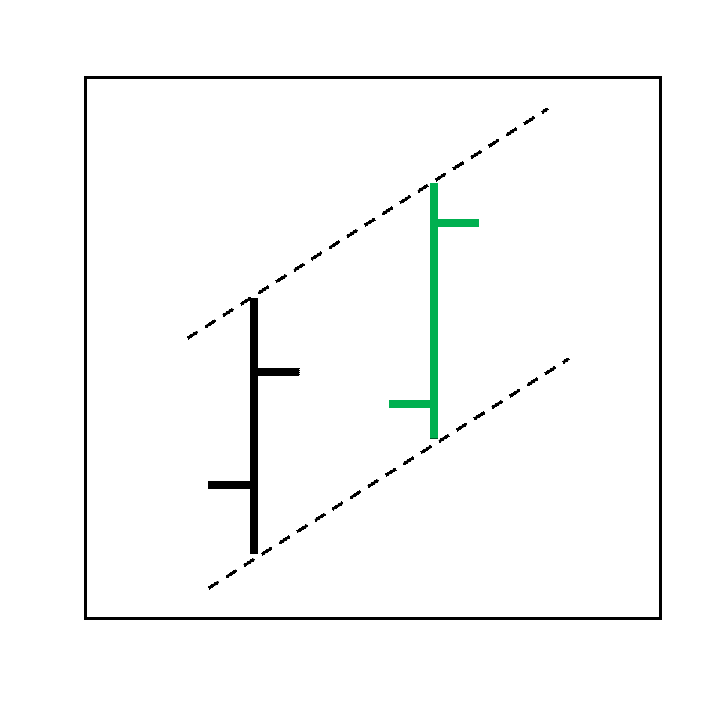
How would you define a bullish day? Just a new high, or a close higher than yesterday? What if the market makes a new high and then tanks? See our Candlestick-1Trend definition below.
Yesterday
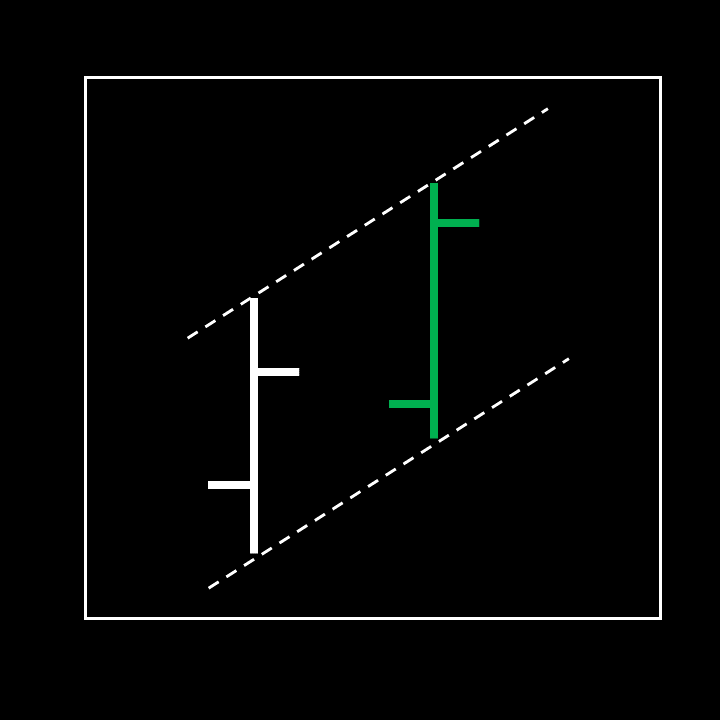
Today
Day +1 Outlook
Day +1 Regime Probabilities
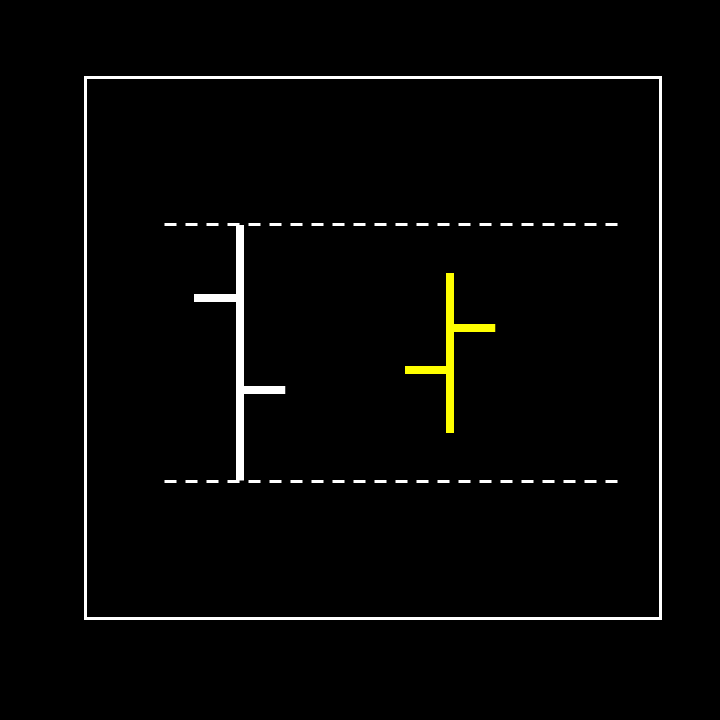
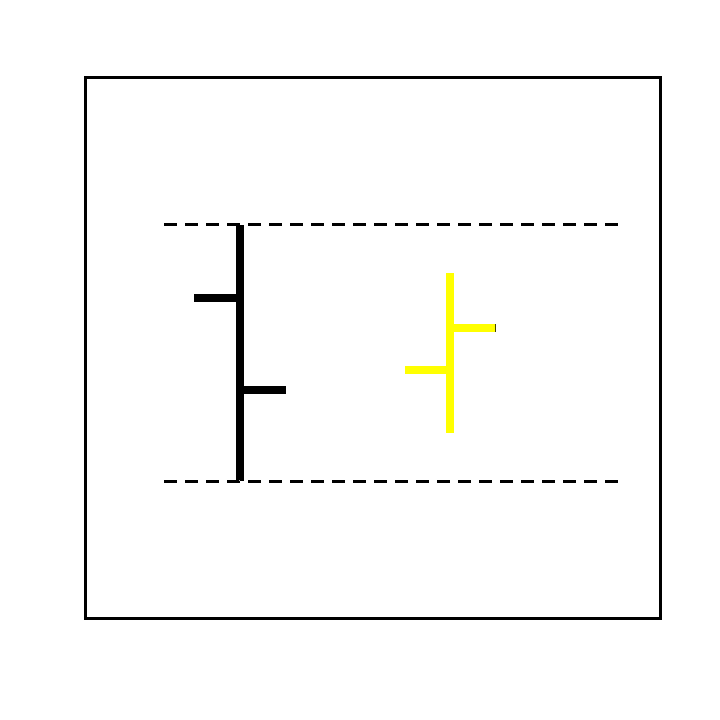
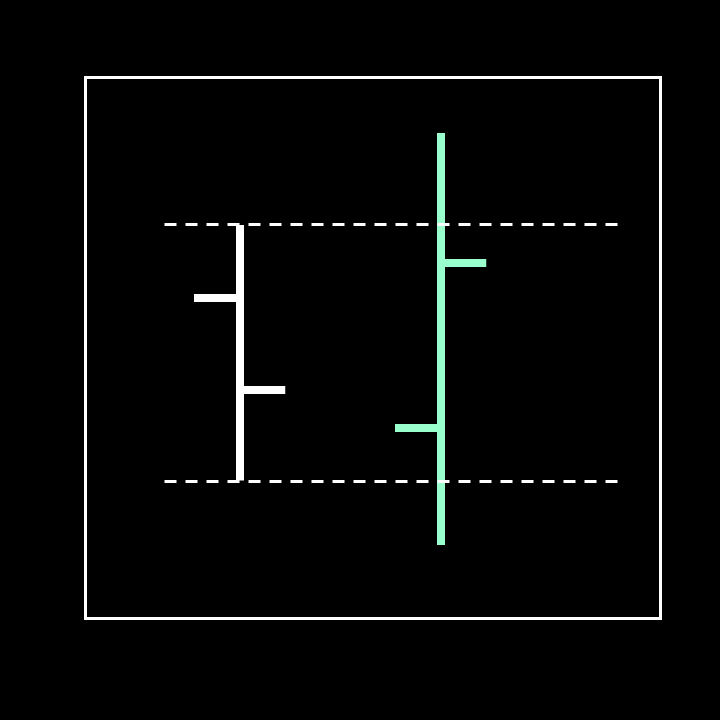
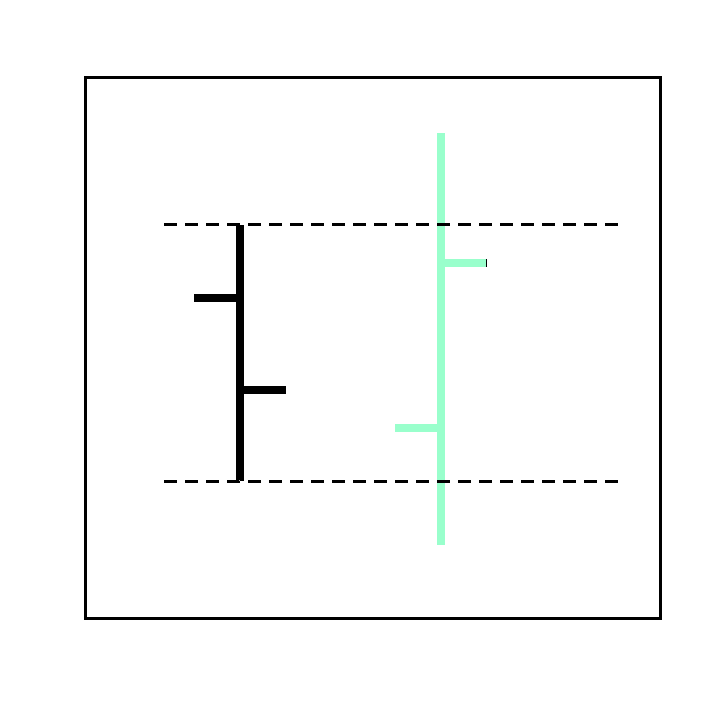
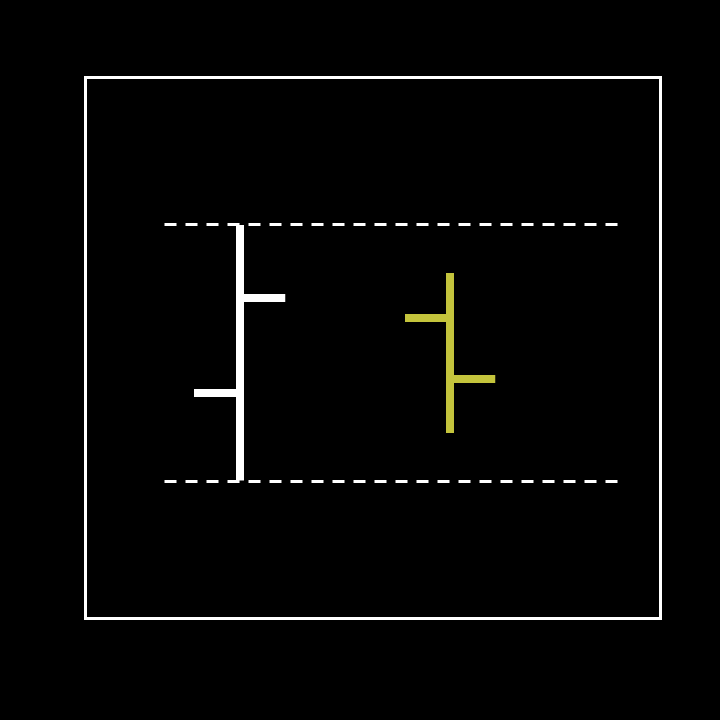
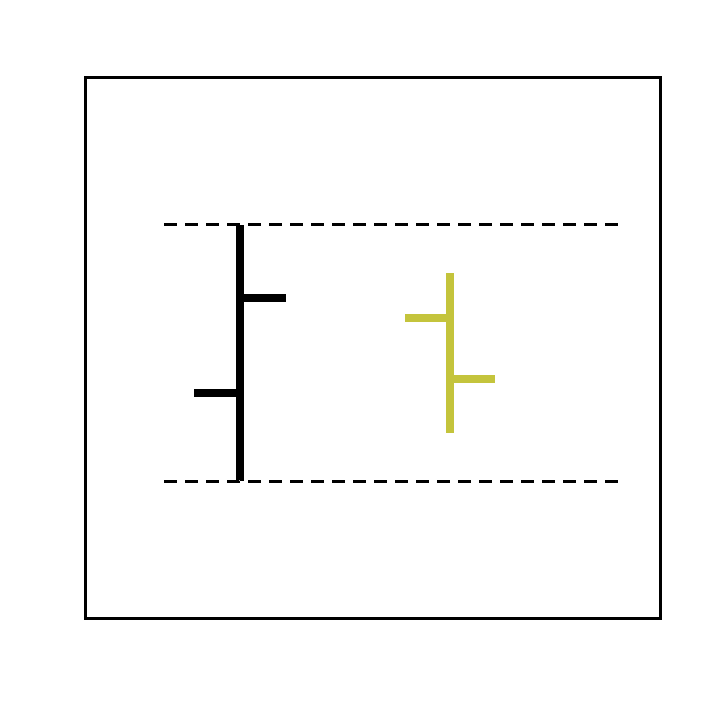
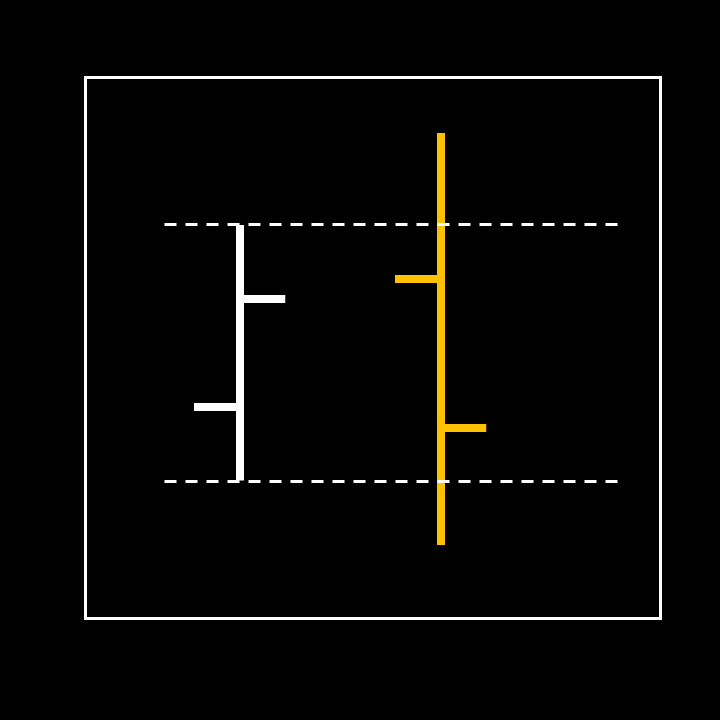
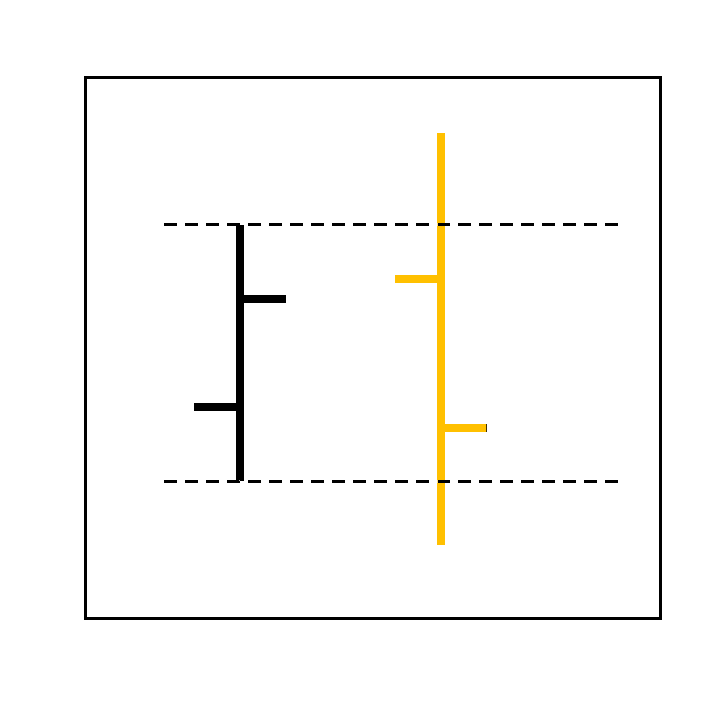
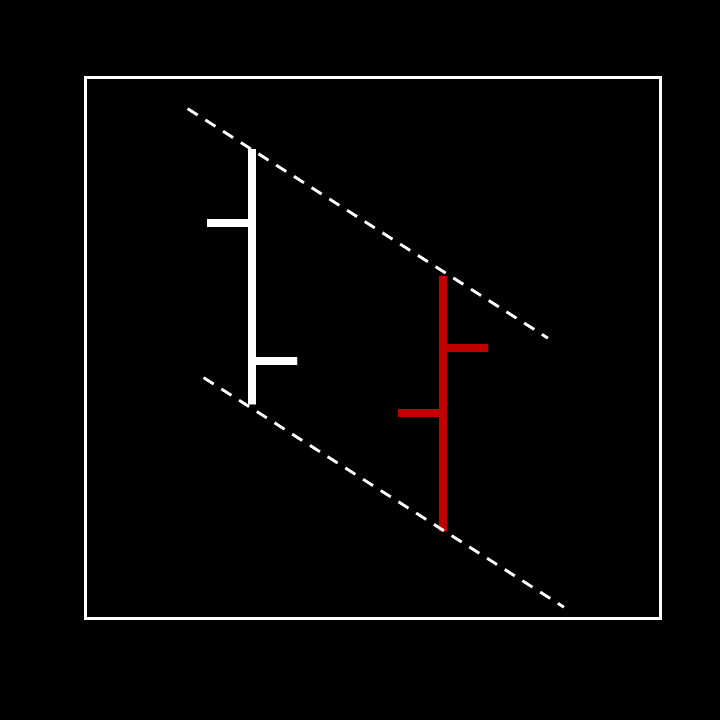
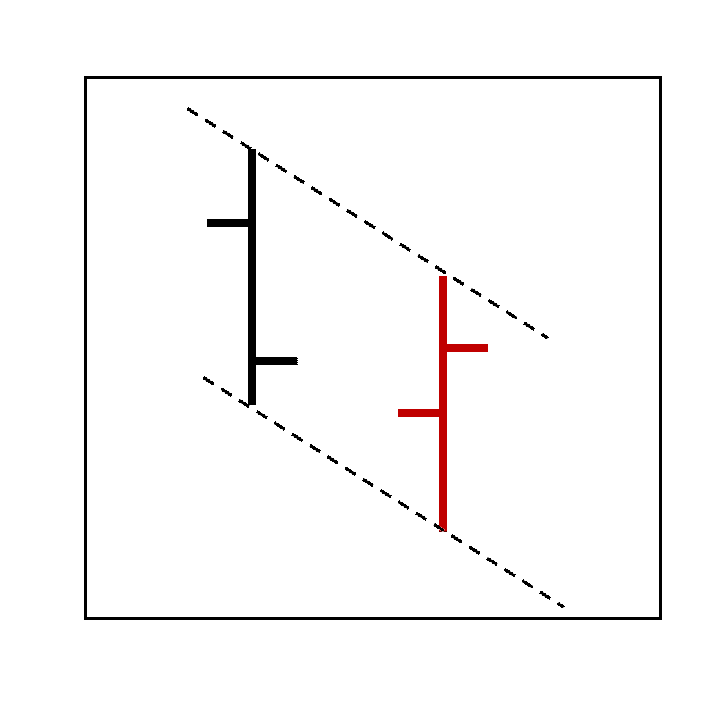
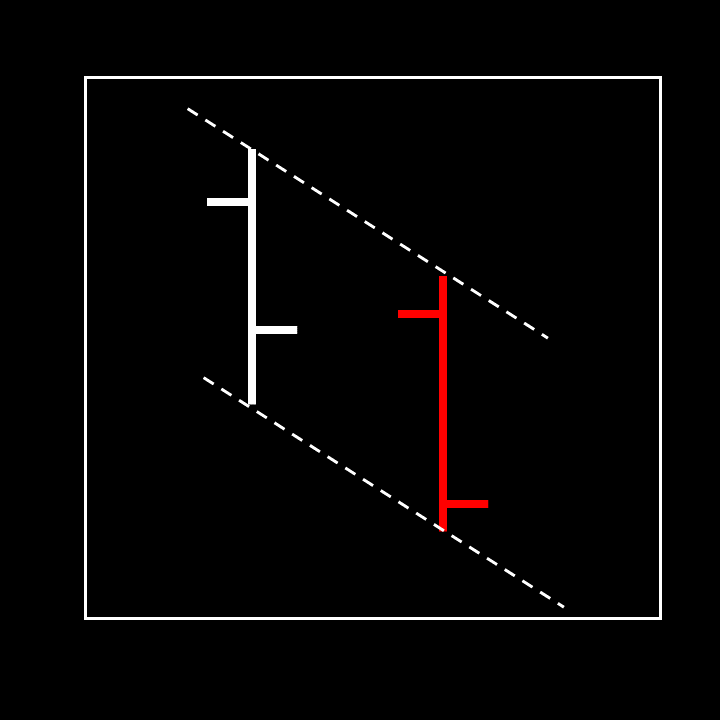
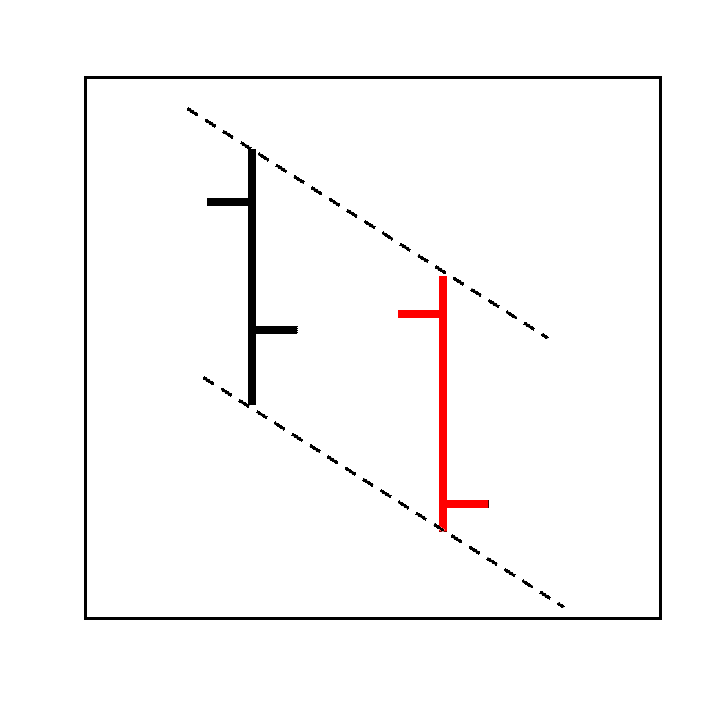
Markov Regime Chart







Markov State Forecast
Probabilistic forecast of future market regimes based on current market conditions.
Current State Index
5-digit state identifier (Daily)
| Component | Value | Include |
|---|---|---|
| 1Candle Regime | - | |
| 2Smart Money Tracker | - | |
| 3SP500 Signal | - | |
| 4Uncertainty | - | |
| 5Risk | - |
5-Day Regime Forecast
| Regime | Day 1 | Day 2 | Day 3 | Day 4 | Day 5 |
|---|---|---|---|---|---|
| Bull Trend | - | - | - | - | - |
| Bull Pullback | - | - | - | - | - |
| Bull Indecision | - | - | - | - | - |
| Bull Turnaround | - | - | - | - | - |
| Bear Turnaround | - | - | - | - | - |
| Bear Indecision | - | - | - | - | - |
| Bear Pullback | - | - | - | - | - |
| Bear Trend | - | - | - | - | - |
| Count | 0 | 0 | 0 | 0 | 0 |
Most Likely Path
Expected market trajectory for the next 5 days based on current regime probabilities. Line color reflects bull/bear balance, bands show prediction uncertainty.
2 Day Markov State Forecast
Extended Markov model using 2-day state combinations for improved pivot detection. The 2D state captures both today's and yesterday's candle pattern, enabling the model to recognize two-day sequences that often precede significant market moves.
Current 2D State Index
5-category 2D state identifier (Daily)
| Component | Value | Include |
|---|---|---|
| 1Candles 2D | - | |
| 2SP500 Regime 2D | - | |
| 3SP500 Signal 2D | - | |
| 4Uncertainty 2D | - | |
| 5Risk 2D | - |
Match Counts
5-Day Regime Forecast (2D)
| Regime | Day 1 | Day 2 | Day 3 | Day 4 | Day 5 |
|---|---|---|---|---|---|
| Bull Trend | - | - | - | - | - |
| Bull Pullback | - | - | - | - | - |
| Bull Turnaround | - | - | - | - | - |
| Bull Indecision | - | - | - | - | - |
| Bear Indecision | - | - | - | - | - |
| Bear Turnaround | - | - | - | - | - |
| Bear Pullback | - | - | - | - | - |
| Bear Trend | - | - | - | - | - |
| Weighted Count | 0 | 0 | 0 | 0 | 0 |
Most Likely Path (2 Day Model)
Understanding the 2 Day Model
The 2 Day Markov Model extends the standard approach by combining two consecutive trading days into a single state. Instead of analyzing just today's candle pattern (e.g., "Bull Trend"), the 2D model captures two-day sequences like "Bull Trend followed by Bear Pullback" (state 82). This provides crucial context that single-day analysis cannot capture.
Why 2-Day Patterns Matter
Markets often exhibit behavior that only makes sense in a multi-day context. A single bearish day means something very different depending on what preceded it:
- State 81 (Bull Trend + Bear Trend): A classic reversal pattern - strong bullish momentum followed by complete reversal. This often signals a potential market top.
- State 11 (Bear Trend + Bear Trend): Consecutive bearish trend days indicate sustained selling pressure - very different from a single down day.
- State 18 (Bear Trend + Bull Trend): A V-shaped recovery pattern - strong bearish action followed by equally strong bullish reversal.
- State 88 (Bull Trend + Bull Trend): Sustained bullish momentum over two days, suggesting strong trend continuation.
Statistical Challenge & Our Solution
Traditional Markov models often fail with 2-day states because the number of unique combinations (64 possible candle pairs) leads to sparse data for rare configurations. We overcome this limitation through frequency-weighted averaging: common patterns contribute more to the forecast than rare ones, ensuring statistical reliability without discarding valuable information from unusual market conditions.
When to Use the 2 Day Model?
The 2 Day model excels at detecting market pivots and reversals. Use it when you suspect the market is at an inflection point - after strong trend days, around key support/resistance levels, or when yesterday's action seems particularly significant. The context matters: a bearish day at a pivotal high (after bull trends) has very different implications than a bearish day during an established downtrend.
What are Markov States?
A Markov State describes a condition or regime that a system occupies at any given moment, where the probability of transitioning to the next state depends only on the current state — not on the history of how the system arrived there.
This principle, known as the Markov Property or "memorylessness," is foundational to understanding complex systems — from physics and biology to economics and financial markets.
"The future is independent of the past, given the present."
From Molecules to Markets
How did a chemist's reaction, a nuclear physicist's reactor, and a mathematician counting letters in poetry give us the tools to understand market regimes? Discover the surprising origins of Markov's insight — and why probabilistic transitions shape everything from atoms to stock prices.
Hidden Markov Models (HMM)
In financial markets, we cannot directly observe the "true" market regime. We only see the outcomes: prices, volatility, volume, and other measurable signals. A Hidden Markov Model addresses this by distinguishing between:
Hidden States
The unobservable market regimes (e.g., "Bull Market," "Bear Market," "High Volatility," "Low Volatility") that drive market behavior but cannot be directly measured.
Observable Emissions
The measurable outputs (returns, volatility, spreads) that are probabilistically generated by each hidden state and allow us to infer which regime is active.
Transition Probabilities
The power of Markov models lies in the transition matrix — a mathematical structure that captures the probability of moving from one state to another:
| From \ To | Bull | Bear | Transition |
|---|---|---|---|
| Bull | High (persist) | Low | Medium |
| Bear | Low | High (persist) | Medium |
| Transition | Variable | Variable | Low (unstable) |
Markets tend to persist in their current regime (high diagonal probabilities) but occasionally transition — and these transitions are where the most significant trading opportunities and risks emerge.
Markov Models in Academic Finance
Markov regime-switching models have become a cornerstone of empirical finance research. Academic studies consistently demonstrate their effectiveness in capturing the structural dynamics of financial markets:
Regime Persistence
Empirical studies show that regime transitions tend to be persistent: once a market enters a state (e.g., high volatility), it often remains there for several periods. This persistence enables better forecasting compared to stationary models. Guidolin & Timmermann (2011), Journal of Economic Surveys
Hidden State Detection
Hidden Markov Models (HMMs) classify market regimes in equities (e.g., S&P 500), outperforming simple benchmarks in capturing stylized facts such as fat tails and volatility clustering. Wang, Lin & Mikhelson (2020), Journal of Risk and Financial Management
Volatility Modeling
Regime-switching extensions to volatility models (e.g., Markov-Switching GARCH) significantly improve the fit for return volatility and better capture turbulent periods compared to standard volatility models. Reher & Wilfling (2011), University of Münster Working Paper
Portfolio Strategies
Regime-based investing strategies — where factor exposures depend on the current regime state — often outperform static strategies and lead to higher risk-adjusted returns under regime shifts. Ang & Timmermann (2011), NBER Working Paper No. 17182
Traditional indicators assume markets behave consistently. Markov models recognize that the rules change depending on the regime — a trend-following strategy that works brilliantly in a bull market may fail catastrophically during a transition.
- Guidolin, M. & Timmermann, A. (2011). Markov Switching Models in Empirical Finance. Journal of Economic Surveys. DOI: 10.1111/j.1467-6419.2011.00601.x
- Wang, M., Lin, Y.-H. & Mikhelson, I. (2020). Regime-Switching Factor Investing with Hidden Markov Models. Journal of Risk and Financial Management. DOI: 10.3390/jrfm13120311
- Ang, A. & Timmermann, A. (2011). Regime Changes and Financial Markets. NBER Working Paper No. 17182
- Reher, G. & Wilfling, B. (2011). Markov-Switching GARCH Models in Finance. University of Münster Working Paper
- Oseifuah, E. K. & Korkpoe, C. H. (2019). A Markov Regime Switching Approach to Estimating the Volatility of JSE Returns. Investment Management and Financial Innovations. DOI: 10.21511/imfi.16(1).2019.17
- Bouteska, A. et al. (2023). COVID-19 and Stock Returns: Evidence from the Markov-Switching Model. Journal of Financial Markets (Elsevier)
- Baitinger, E. & Hoch, L. (2024). A Comparative Analysis of HMM and HSMM for Regime-Based Asset Allocation. SSRN. DOI: 10.2139/ssrn.4796238
Our Markov Model: A Different Approach
While academic Markov models have proven valuable, they share a common limitation: they react too slowly to market changes. Most implementations rely on lagging indicators like moving averages, ADX, or ATR to define regimes — indicators that smooth price action and inherently delay regime detection.
The Problem with Traditional Regime Detection
Traditional Markov models exhibit high regime persistence and low transition probabilities — a mathematical artifact of using slow-moving indicators. When a 50-day moving average defines your trend, the model cannot recognize that the market changed direction today. But markets can and do reverse within a single session.
Candle-Based Regime Detection
Our model takes a fundamentally different approach: regimes are defined purely by candlestick structure. Each bar's relationship to the previous bar — higher high, lower low, strong close, weak close — determines the current regime. This allows our model to:
Switch Regimes Daily
The model can transition from one regime to another within a single day — matching the true speed of market dynamics.
Higher Transition Probabilities
By not artificially smoothing regimes, our transition matrix reflects realistic probabilities of regime change.
Lower Persistence Bias
Unlike indicator-based models, we don't assume the current regime will persist simply because a lagging average hasn't crossed yet.
Matching Trader Perception
Consider a day where price makes a higher high but closes weak and prints a new low. Traditional indicators might still show "bullish" because the moving average hasn't rolled over. But no trader feels bullish about that candle — and neither does our model.
Our goal is to accurately describe how bullish or bearish the next day is likely to be — matching the intuitive perception of experienced traders rather than the mathematical abstractions of lagging indicators.
Enhanced by Backtested Indicators
While candle structure forms the foundation, we enhance regime detection with extensively backtested market indicators. The 5-digit state index combines:
- Candle Regime — The pure price structure (8 states)
- Smart Money Tracker — Broad market health composite (6 states)
- Signal State — Impulse and accumulation/distribution signals
- Uncertainty Level — Market phase and volatility regime
- Risk State — Quantified risk environment
This multi-dimensional approach yields high predictive probabilities for the next day's regime, enabling traders to position themselves with probabilistic confidence rather than reactive indicators.
The 8 Markov Regimes Explained
Each candle pattern represents a distinct market regime with specific characteristics:
Bull Regimes
Bull Trend
This is the typical trend candle one wants to see. A clear bullish direction with a higher high and a higher low and with a strong close.
Bull Pullback
This bearish looking candle has a weak, negative close but does not destroy the bullish trend, as a higher low and a higher high is formed. This pullback represents a comparable "cheap" buying opportunity, if the trend persists.
Bull Turnaround
Being a powerful outside bar, this candle forms a lower low and a higher high at the same time. With a strong close it often marks the onset of a bullish trend after a range market.
Bull Indecision
This inside bar is the classical range market candle, with a small range, signalling a continuation of the sideways market behaviour. The positive close hints at a slightly bullish bias.
Bear Regimes
Bear Indecision
This inside bar is the classical range market candle, with a small range, signalling a continuation of the sideways market behaviour. The negative close hints at a slightly bearish bias.
Bear Turnaround
Being a powerful outside bar, this candle forms a lower low and a higher high at the same time. With a weak close it often marks the onset of a bearish trend after a range market.
Bear Pullback
This bullish looking candle has a strong, positive close but does not destroy the bearish trend, as a lower high and a lower low is formed. This pullback represents an opportunity to exit longs or initiate shorts, if the trend persists.
Bear Trend
This is the typical trend candle one wants to avoid being long. A clear bearish direction with a lower high and a lower low and with a weak close.
Practical Application
The Markov Regime Analysis provides:
Regime Identification
Know which market regime is currently active with probabilistic confidence levels.
Transition Warnings
Detect early signals of regime shifts before they become obvious in price action.
Strategy Adaptation
Adjust trading strategies dynamically based on the current regime environment.
Markets don't just move — they move differently depending on which regime they occupy.
A Markov model doesn't predict the next price move. It answers a more fundamental question: What kind of market are we in right now, and how likely is that to change?
The Core Insight
"Knowing where you are matters more than knowing where you're going — because where you are determines which rules apply."