The Aqueduct Principle
Why Trends Persist and Why They End
The Romans built aqueducts to move water over long distances in a controlled and orderly way. Not fast. Not aggressively. But steadily and reliably.

A tiny gradient was enough to keep water flowing for decades — sometimes centuries — as long as the structure was maintained. This is where the analogy to financial markets begins.
In a functioning aqueduct, water follows a clearly defined path. The stones, arches, and channels impose structure, preventing the flow from dispersing into chaos. In markets, capital behaves the same way. When money is guided by clear trends, strong narratives, and sufficient liquidity, it flows in one dominant direction. Prices move smoothly. Volatility stays contained. Trends emerge.
Think of water flow as money flow. The gradient is the trend. The physical structure is market structure. And maintenance — the constant repair work that keeps everything aligned — is liquidity and confidence.
As long as this structure holds, markets exhibit order. Capital compounds in the direction of least resistance. Small advantages accumulate. Trends persist — not because markets are calm, but because the flow is guided.
A Roman aqueduct rarely collapsed overnight. Instead, small cracks went unrepaired. Sediments accumulated. Vegetation grew between stones. The gradient became uneven. Over time, water slowed, diverted, and eventually stopped flowing altogether.
Financial markets behave in the same way. When liquidity dries up, trust erodes, or rules lose credibility, money no longer follows clean channels. The flow becomes erratic. Volatility rises. Sudden reversals replace smooth trends. Chaos does not arrive with a single shock — it creeps in through neglect.
Importantly, no one has to destroy the system.
Both aqueducts and markets decay automatically.
Order always requires effort. Disorder does not.
Without sufficient liquidity, functioning market makers, credible institutions, and stable expectations, markets drift toward high-entropy states. Sideways ranges, whipsaws, false breakouts, and violent regime shifts are not anomalies — they are the natural default.
This also explains why trends always end. They do not die because of one bad headline or a single data point. They fade as the money flow weakens, becomes uneven, and finally loses direction. Momentum flattens. Pullbacks deepen. Volatility replaces trend.
The Core Insight
"The financial market is an aqueduct: as long as money flows along a maintained structure, trends persist — when order fades, chaos inevitably wins."
Entropy — From Chemistry to Markets
What Entropy Really Means
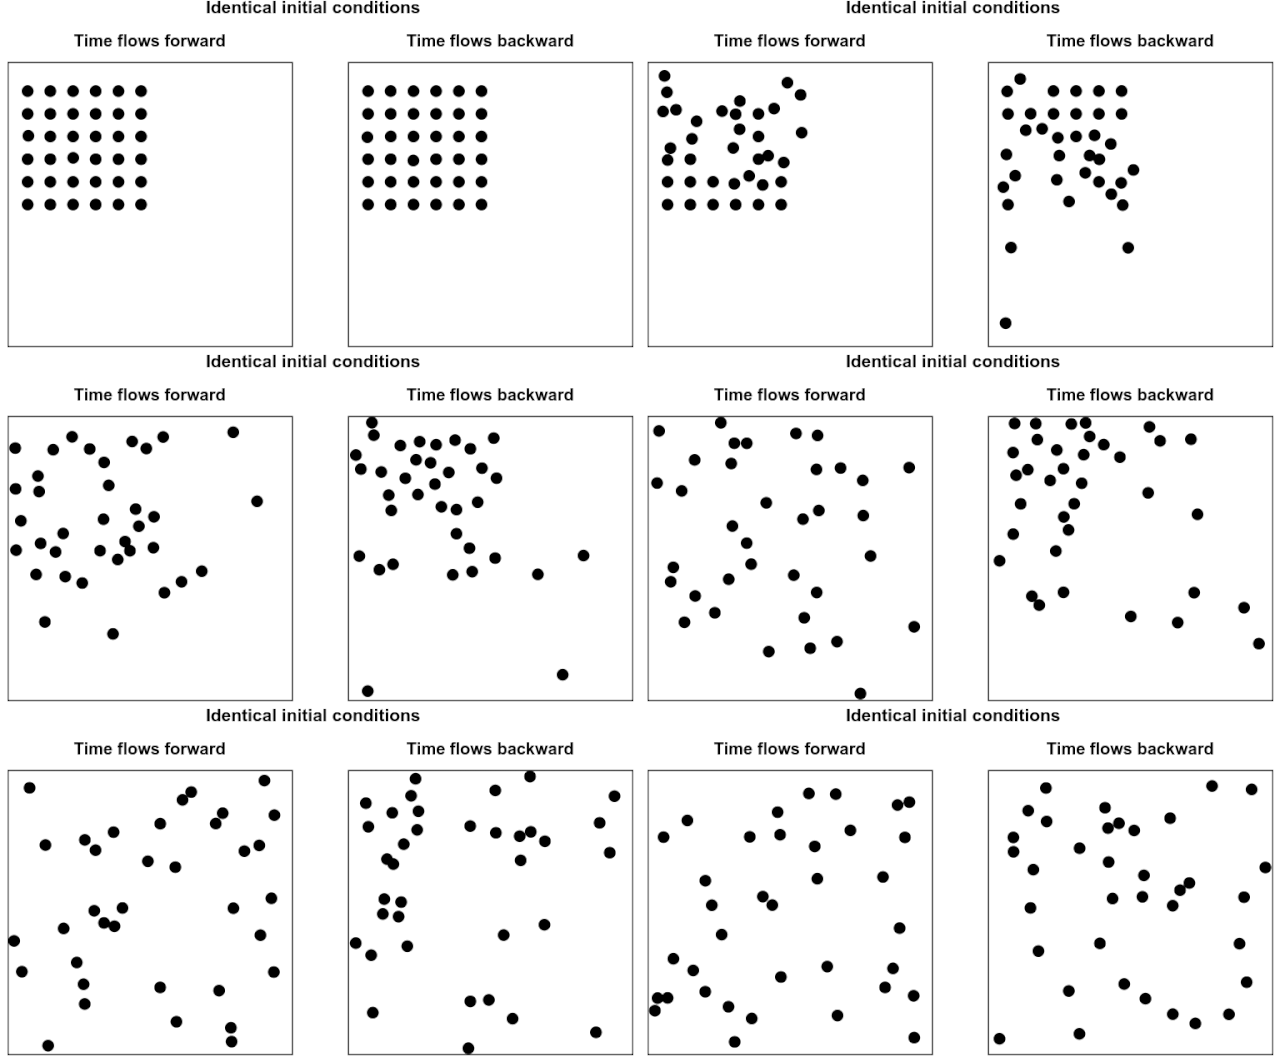
In its most general form, entropy measures disorder, uncertainty, or the number of possible states a system can take. This concept was not invented for finance — it originates in thermodynamics and chemistry, where entropy is a fundamental law of nature.
Low Entropy
Few possible states — structured, predictable behavior. Like a crystal lattice at low temperature where atoms are fixed in place.
High Entropy
Many possible states — randomness, instability, loss of structure. Like gas molecules moving freely in all directions.
The Second Law of Thermodynamics states: In an isolated system, entropy tends to increase over time. Order decays naturally. Chaos is the default.
Shannon Entropy in Markets
Claude Shannon transferred the entropy concept to information theory. Instead of molecules, he studied messages and symbols. Shannon entropy measures how uncertain the next symbol is and how much information is gained when it appears.
Low Entropy Market
Price moving smoothly in one direction — outcomes are biased. Like a crystal: ordered and predictable.
High Entropy Market
Price jumping unpredictably between many levels — outcomes are evenly spread. Like gas: random and chaotic.
Why Entropy Matters for Trading
Financial markets are open, energy-driven systems where capital flows act as energy input, volatility serves as thermal agitation, and trends represent temporary order. Just like in chemistry: order can exist, but it is temporary, and entropy constantly works against it.
The Big Picture
This indicator does not try to predict price. Instead, it answers a more fundamental question:
"Is the market currently ordered enough for prediction to make sense?"
Direction comes second. Structure comes first.
Technical Components
Uncertainty % — What It Measures
Shannon Entropy
Measures the randomness of price distribution — how unpredictable the next move is.
Permutation Entropy
Detects breakdown of price patterns — when familiar structures stop working.
Lyapunov Exponent
Measures sensitivity to small disturbances — chaos theory's core metric.
RQA Divergence
Tracks stability of recurring price structures over time.
TrendScore % — Structural Persistence
Hurst Exponent
Measures long-term memory and trend persistence in price series.
Fractal Dimension Index
Quantifies geometric complexity of price paths.
RQA Determinism
Measures structural stability and predictability over time.
Ehlers Super Smoother
Determines trend direction with minimal lag.
Important: This indicator does not generate buy or sell signals. It is a market context filter designed to help you decide how to trade based on current market structure.