▶ Watch this as a video on YouTube
At first glance, Javier Milei and Donald Trump appear to be following a similar economic playbook: shrink government, cut bureaucracy, deregulate the economy, reduce welfare spending, and unleash private-sector growth. Both administrations have challenged the traditional role of government and promised to replace an expanding state with a more market-driven economy.
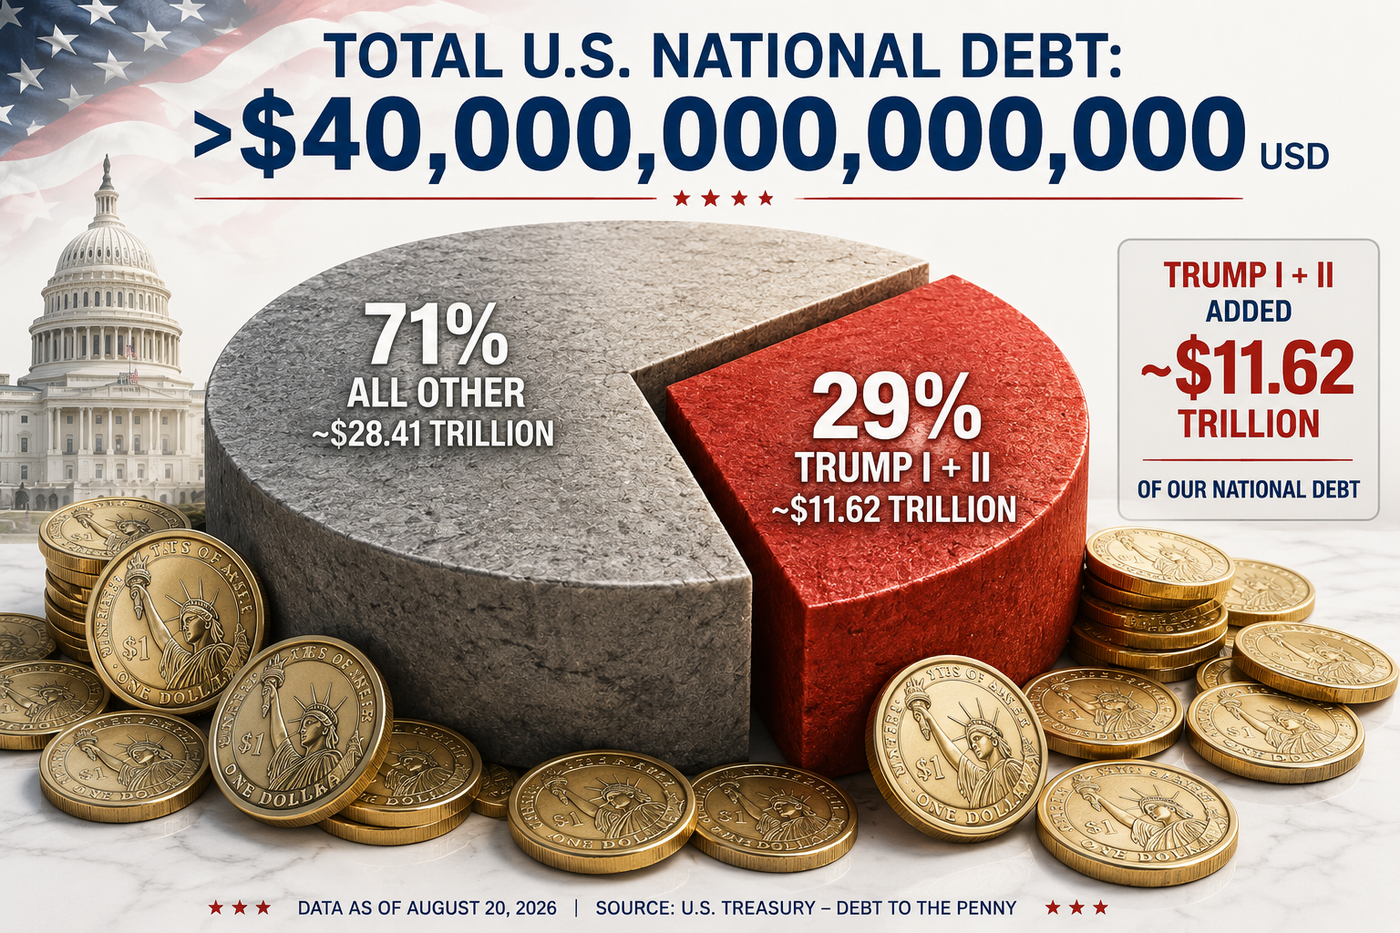
U.S. debt accumulation has accelerated across recent administrations. Trump’s first term added roughly $7.8 trillion, while his second term has already added another $3.8 trillion, bringing the combined increase during his presidencies to about $11.6 trillion. The United States does have a statutory debt ceiling, but it does not directly limit government spending or deficits; it limits how much Treasury can borrow to finance obligations already authorized by Congress. In practice, Congress has repeatedly raised or suspended the ceiling when debt approaches the limit. Most recently, the One Big Beautiful Bill Act of 2025 raised the ceiling by $5 trillion to $41.1 trillion, making it more of a recurring political constraint than a hard fiscal brake (U.S. Treasury – Debt Limit).
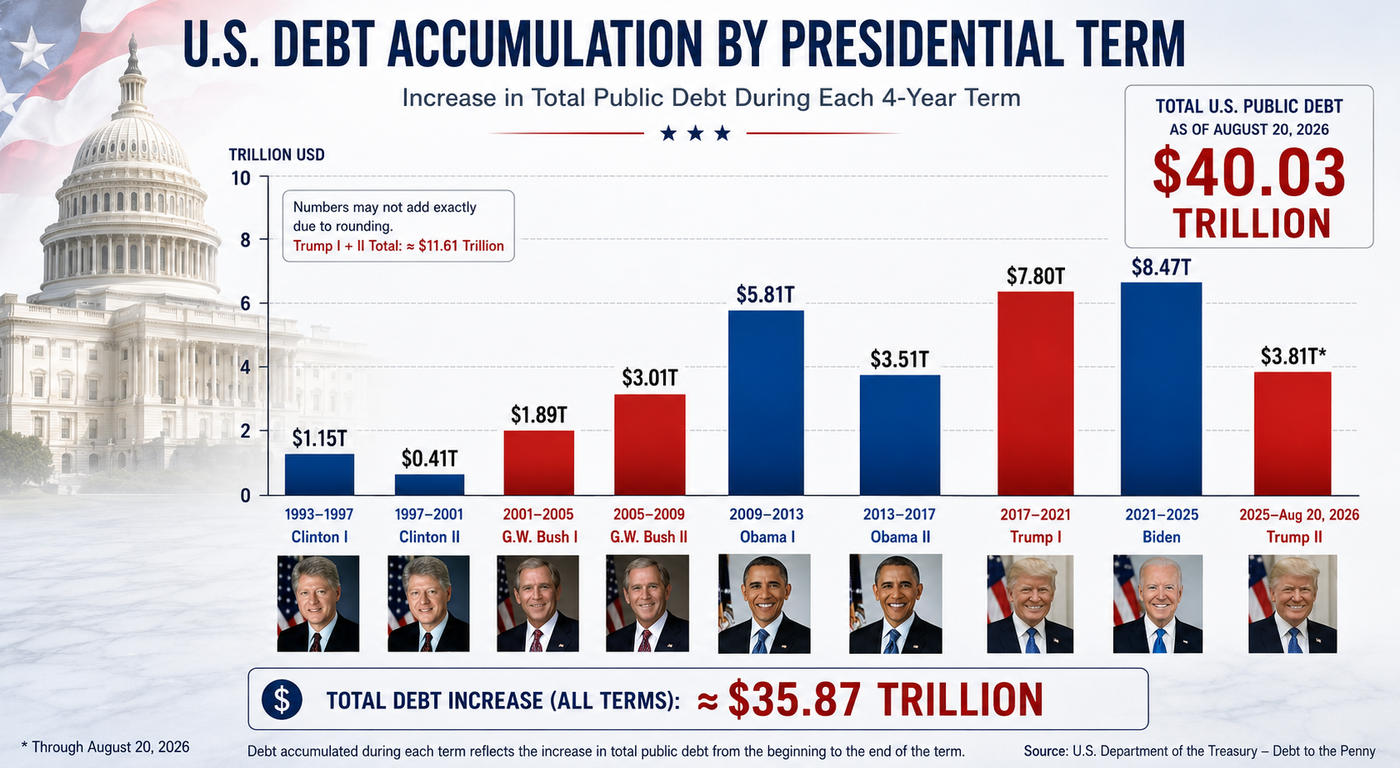
Trump I (2017–2021): Federal debt increased by roughly $7.8 trillion, with the largest surge occurring during the COVID-19 crisis. A substantial part of this borrowing flowed directly into the real economy through stimulus checks, expanded unemployment benefits, PPP loans and other emergency programs, providing households and businesses with immediate liquidity and generating a demand impulse. The remainder reflected a mixture of pre-existing structural deficits, lower revenues, the 2017 tax cuts, mandatory spending and debt-service costs. These components did not necessarily translate into equivalent new productive investment; some income was saved or ultimately flowed into financial and other assets.
Biden (2021–2025): Federal debt increased by roughly $8.5 trillion. Early in the administration, pandemic relief again flowed directly into household income and consumption, while later policies increasingly directed federal money toward the real economy through infrastructure, semiconductor manufacturing, energy and industrial investment. However, a growing portion of federal expenditure was absorbed by Social Security, Medicare and other existing mandatory commitments, as well as rapidly rising interest payments on the accumulated debt. In other words, Biden continued to inject substantial money into the economy, but an increasing share of government financing was required simply to service existing obligations rather than create new economic capacity.
Government debt is not inherently good or bad — what matters is what the borrowed money finances. Debt used for infrastructure, research, education or productive investment can increase an economy’s future capacity and potentially generate enough additional growth and tax revenue to justify its cost. Debt-financed transfers or tax cuts can also stimulate demand, particularly when the money reaches households likely to spend it. The equation becomes less favorable when borrowing increasingly finances interest payments, inefficient spending or the refinancing of existing debt. In that case, debt continues to grow without creating corresponding productive capacity, while higher interest expenses consume an increasing share of future government revenues.
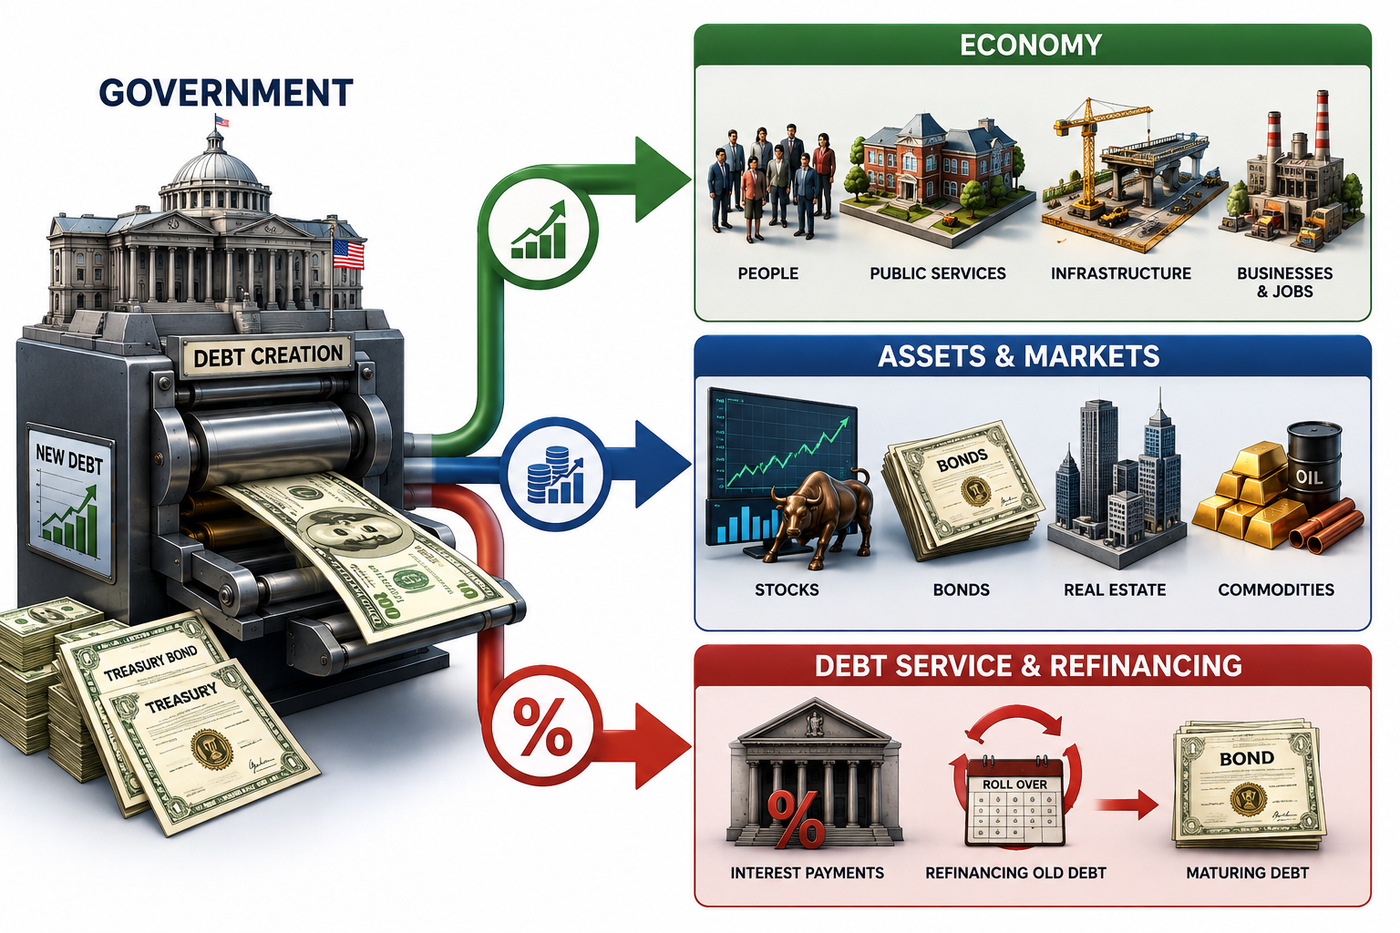
Debt is not inherently bad. When borrowing finances productive investment, infrastructure and economic growth, it can strengthen an economy. The problem begins when new debt no longer creates sufficient growth and is increasingly used to inflate assets, cover deficits or service existing debt.

USA: Who owns the debt?
Federal Reserve: $4.6 Tn Mutual Funds: $4.4 Tn Foreign holders: $9.2 Tn
Holders of U.S. federal debt held by the public. Source: Congressional Budget Office.
U.S. Treasury – Debt to the Penny
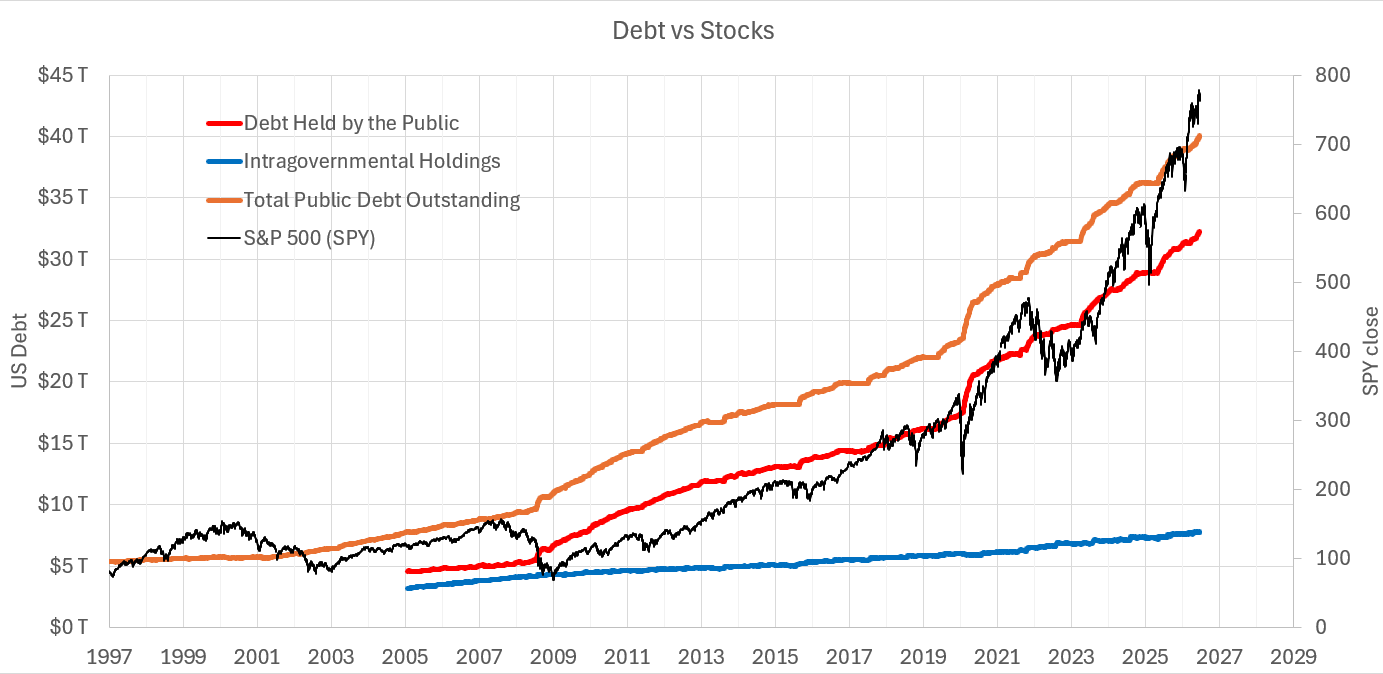
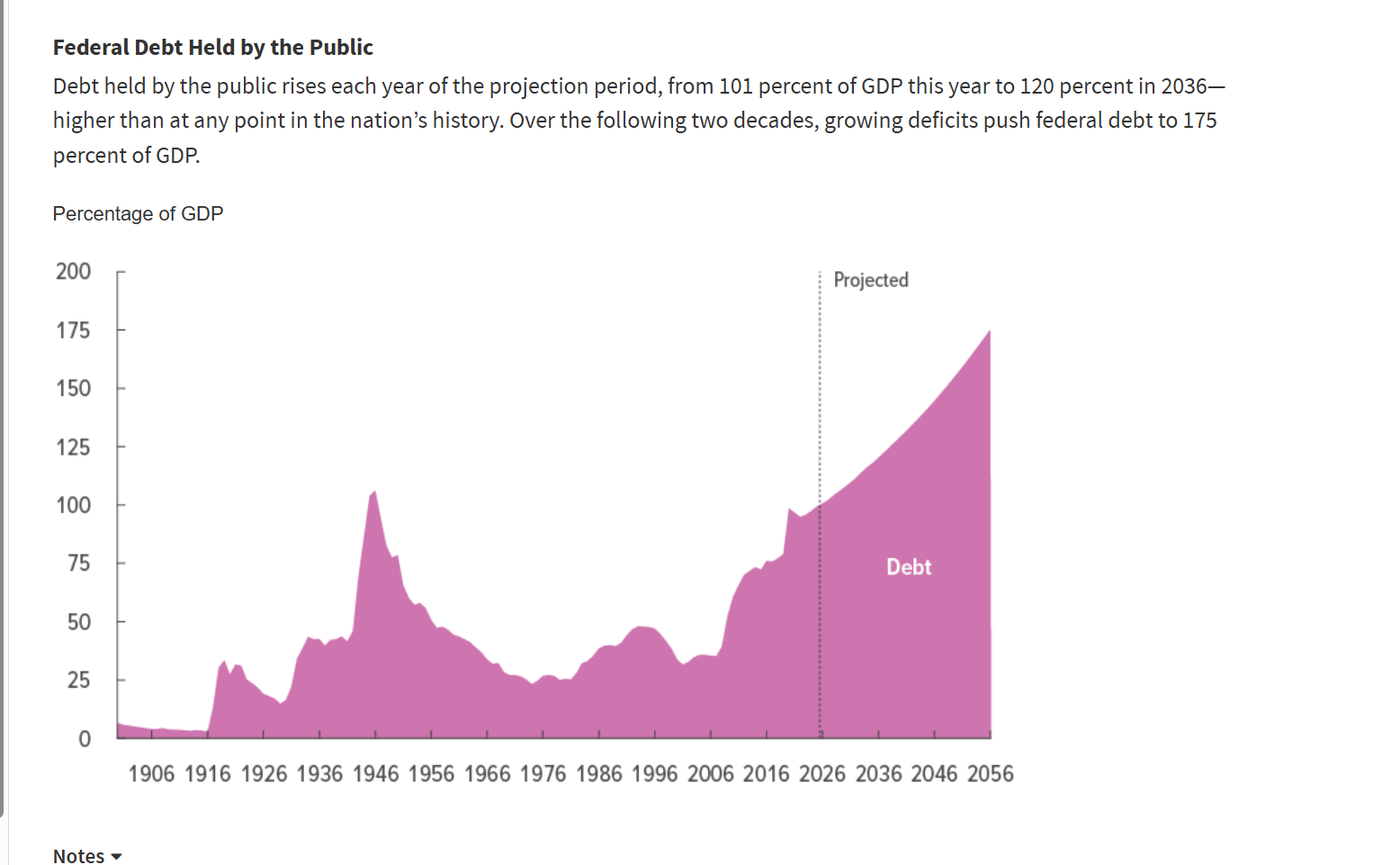
US debt historical chart
The structural shift is visible here. After the Global Financial Crisis, U.S. government debt began to expand rapidly. At roughly the same time, one of the longest and strongest bull markets in history began. Ultra-low interest rates, quantitative easing and abundant liquidity helped push capital into financial assets.
Of course, this was not exclusively a story about the wealthy. Millions of Americans benefited through 401(k)s, pension funds and rising home values. But there is an important distinction between asset-price inflation and productive economic investment. A dollar that bids up the price of an existing stock or property does not necessarily finance a new factory, increase productivity or immediately generate additional consumption. In that sense, financial markets can become a kind of reservoir for excess liquidity: large amounts of wealth accumulate in assets without translating proportionally into demand in the real economy.
In theory, this process can continue for a long time: issue more debt, provide more liquidity, refinance at ever-lower rates and watch asset valuations rise. As long as inflation remains subdued and interest rates trend downward, the system is forgiving.
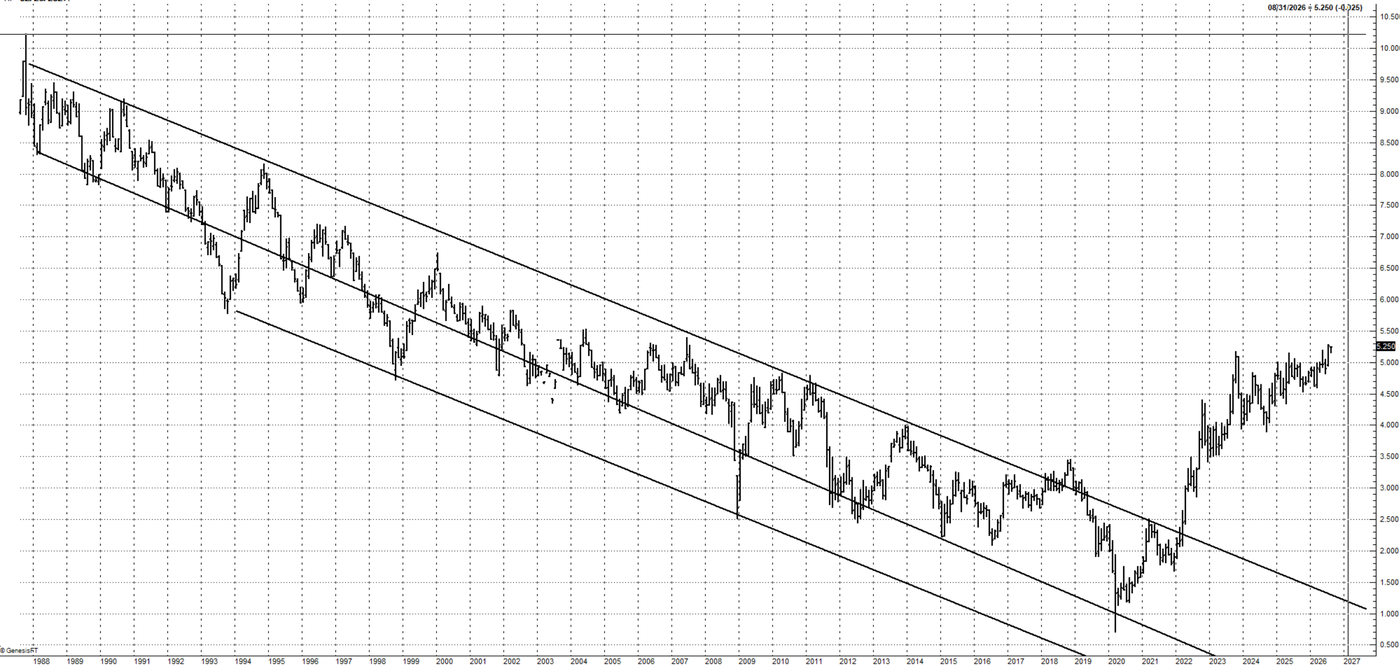
US 30y treasury yields – historical chart
For roughly four decades, the developed world operated within a secular disinflationary environment, in which interest rates repeatedly made lower highs and lower lows. After 2020, that regime was disrupted. The COVID-19 pandemic triggered a large monetary and fiscal response, flooding the financial system and the broader economy with liquidity. Inflation subsequently returned with force, compelling central banks to raise interest rates aggressively and contributing to a decisive break of the multi-decade downtrend in bond yields.
The secular decline in yields may eventually have ended anyway, as several underlying structural forces were already beginning to shift. At the extreme, countries such as Germany and Switzerland were able to issue government debt at negative yields, meaning investors effectively paid the government for the privilege of lending it money. But the pandemic shock, the large policy response, and the inflation that followed almost certainly accelerated the transition into a new interest-rate regime.
That matters for fiscal policy. Debt accumulation is relatively painless when the cost of refinancing keeps falling. It becomes progressively more dangerous when interest rates remain structurally higher. More government revenue must then be diverted toward servicing existing debt, leaving less room for productive investment, tax relief or social spending.
The fundamental question is therefore no longer simply how much debt the United States can issue. It is whether the economic regime that made decades of expanding debt affordable still exists.
And there are increasing reasons to believe that something fundamental has changed.
Over the previous three administrations, Argentina repeatedly relied on deficit spending, subsidies, transfers and public-sector expenditure to support domestic demand, with the Fernández governments leaning particularly heavily on energy and transport subsidies, social transfers and, during Alberto Fernández’s presidency, pandemic support. Macri attempted a more gradual fiscal adjustment, but persistent deficits and reliance on external borrowing ultimately left the country vulnerable when market confidence deteriorated.
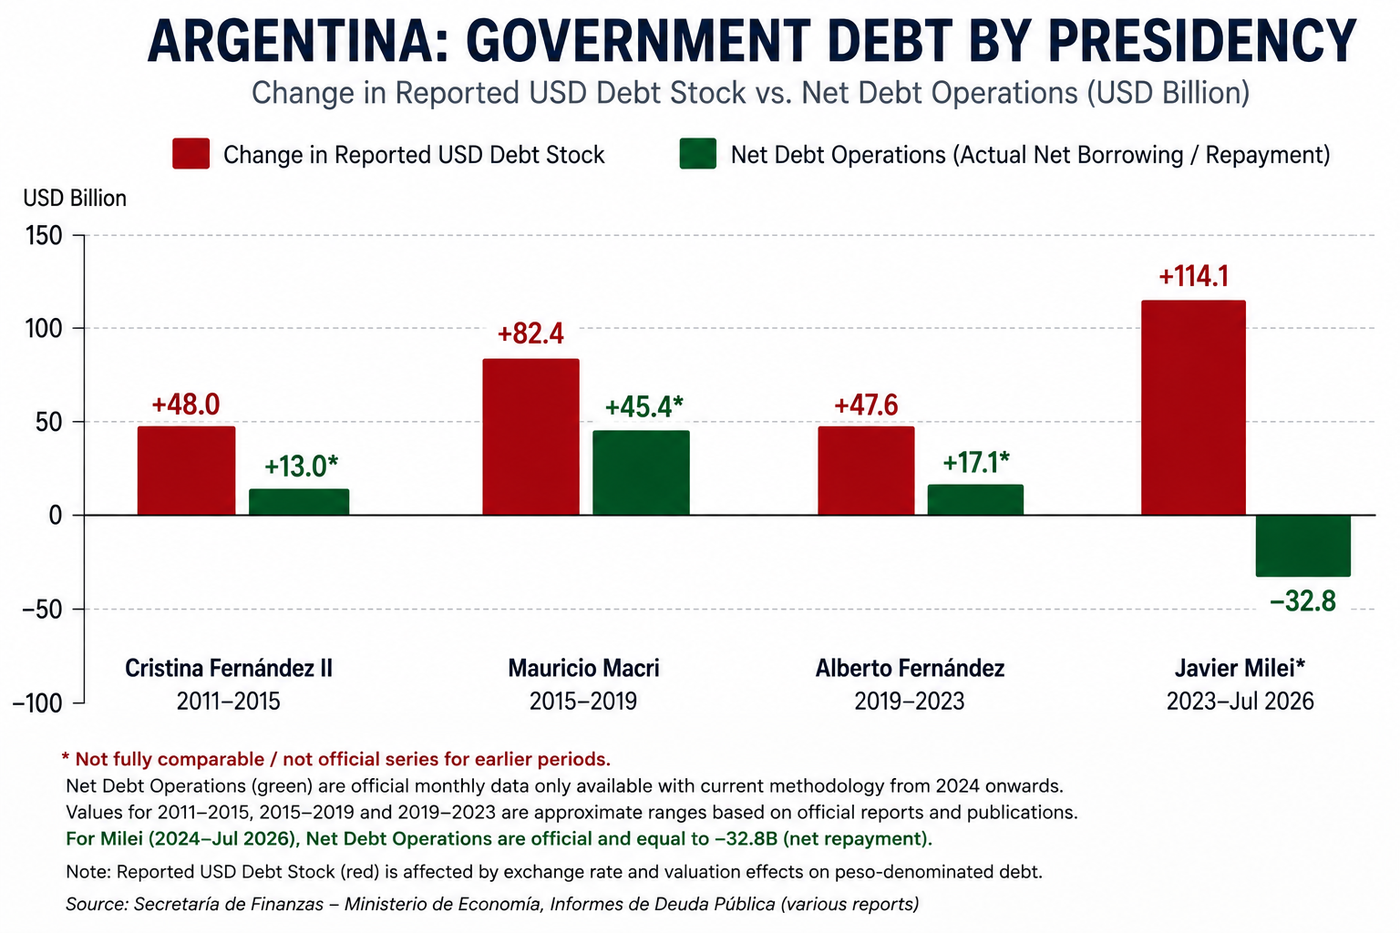
Milei represents a fundamental reversal of this approach: instead of using government borrowing and spending to stimulate demand, his administration has aggressively cut expenditures and subsidies, reduced transfers and public investment, and moved the primary budget into surplus. The short-term effect is less government-driven demand, but the strategy is designed to restore fiscal credibility, suppress inflation and country risk, and ultimately shift the engine of growth from the public balance sheet toward private investment and productivity.
Beneath these similarities lies a fundamental divide. Milei treats the fiscal deficit itself as the problem, accepting severe short-term adjustments to balance the budget and stop the accumulation of debt. The current U.S. administration, by contrast, combines spending cuts and deregulation with tax reductions, tariffs, and continued large fiscal deficits. The table below compares the two approaches measure by measure — and shows where the economic strategies align and where they move in opposite directions.
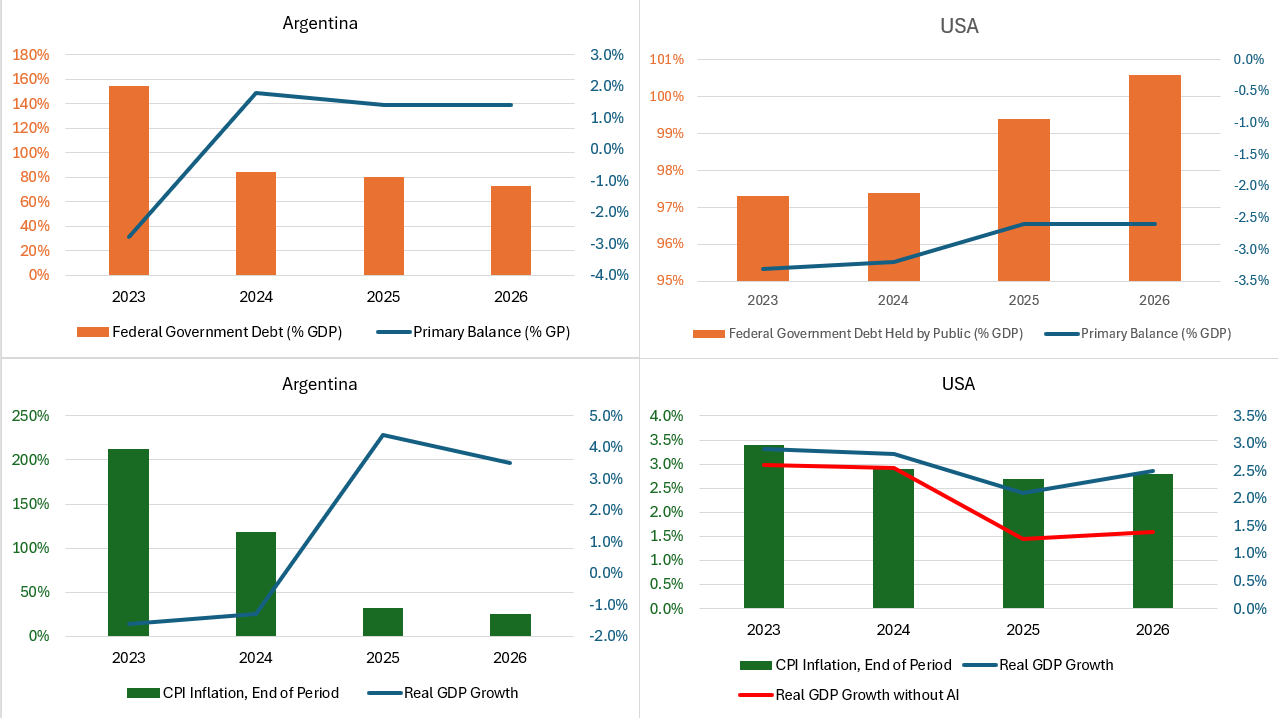
Argentina vs. USA: Comparison of Debt, Inflation and GDP
| Year | Argentina Primary Balance (% GDP) | Argentina Federal Government Debt (% GDP) | Argentina CPI Inflation (EOP) | Argentina Real GDP Growth | U.S. Primary Balance (% GDP) | U.S. Federal Debt Held by Public (% GDP) | U.S. CPI Inflation (EOP) | U.S. Real GDP Growth | U.S. Real GDP Growth ex AI* | AI Contribution to U.S. GDP Growth* |
|---|---|---|---|---|---|---|---|---|---|---|
| 2023 | -2.8% | 154.6% | 211.4% | -1.6% | -3.3% | 97.3% | 3.4% | 2.9% | 2.6% | 0.30 pp |
| 2024 | +1.8% | 84.7% | 117.8% | -1.3% | -3.2% | 97.4% | 2.9% | 2.8% | 2.55% | 0.25 pp |
| 2025 | +1.4% | 80.3% | 31.5% | +4.4% | -2.6% | 99.4% | 2.7% | 2.1% | 1.26% | 0.84 pp |
| 2026E | +1.4% | 73.2% | 25.0% | +3.5% | -2.6% | 100.6% | 2.8% | 2.5% | 1.39% | 1.11 pp |
Green = favorable · Amber = caution · Red = unfavorable
Notes:
2026 values are estimates or projections. U.S. Real GDP Growth ex AI is an approximate calculation based on estimated AI-related investment contributions and is not an official GDP statistic. AI contribution to U.S. GDP growth is expressed in percentage points (pp), not percent.
The emerging U.S. debt problem is increasingly an interest-cost problem. The Congressional Budget Office projects net federal interest spending to rise from 3.3% of GDP in 2026 to 4.6% in 2036.
Sources:
International Monetary Fund – Argentina: 2026 Article IV Consultation — Argentina fiscal, debt, inflation and economic projections.
INDEC – Official Argentine CPI Data — Official Argentine inflation data.
Congressional Budget Office – The Budget and Economic Outlook: 2026 to 2036 — U.S. fiscal outlook, federal debt, deficits, economic projections and net interest expenditure.
The stabilization plan of the Milei administration averted a full-blown crisis and brought the previous Fund-supported program back on track. The stabilization plan has yielded material results: a strong economic recovery is underway.
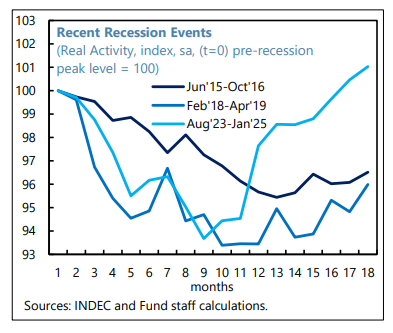
Argentina under Milei is currently trying to break this cycle primarily by reducing the government’s financing requirement itself: spending cuts, subsidy reductions and fiscal consolidation turned the federal primary balance from a deficit into a surplus, reducing dependence on new borrowing and monetary financing. The United States is pursuing almost the opposite fiscal strategy: despite solid economic growth, Washington continues to run substantial primary deficits, while rising interest costs require an increasingly large share of federal spending. Some U.S. borrowing undoubtedly finances productive areas such as infrastructure, defense, semiconductor capacity and research, but a growing portion of the fiscal burden reflects existing commitments and debt service rather than new productive investment. The fundamental contrast is therefore simple: Argentina is attempting to reduce the amount it needs to finance; the United States is relying much more heavily on continued growth to carry an expanding debt burden.
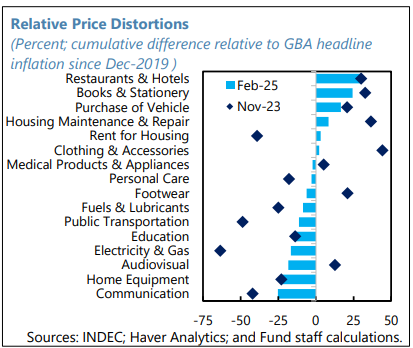
Since late 2023, and following an initial FX correction, the rapid disinflation has been driven by the price of tradable goods, also supported by trade liberalization measures.
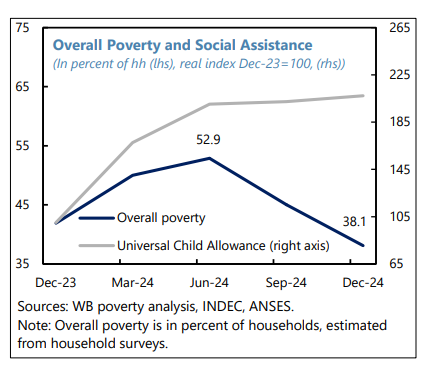
Social conditions have improved, though remain fragile.
Strict fiscal discipline remains the key policy anchor. Fiscal and domestic financing efforts have materially reduced debt rollover risks. Monetary and FX policies have been instrumental in supporting disinflation.
| Measure / Policy | Milei – Argentina | Impact on Argentina | USA – Current Administration | Same Direction? |
|---|---|---|---|---|
| Cut government spending | Large real spending cuts | Deficit ↓, financing needs ↓ | Cuts to selected agencies and programs, but overall federal spending remains high | ⚠️ Mixed |
| Shrink government bureaucracy | Ministries consolidated, public-sector jobs reduced | Recurring government costs ↓ | Federal workforce and agencies reduced/restructured | ✅ |
| Reduce subsidies | Energy and transport subsidies substantially reduced | Structural spending ↓ | Selected subsidies and climate/energy programs reduced | ✅ |
| Cut public investment | Many public infrastructure projects suspended or transferred | Immediate spending ↓ | Selected programs cut, while other investment priorities remain | ⚠️ Mixed |
| Restrain welfare spending | Social and pension spending initially fell sharply in real terms | Government spending ↓ | Cuts/restrictions to Medicaid, SNAP and other programs | ✅ |
| Increase tax revenue for consolidation | Temporary and permanent revenue measures accompanied spending cuts | Fiscal balance ↑ | Major tax reductions/extensions | ❌ |
| Achieve a primary surplus | Yes – a central fiscal anchor | Financing requirement ↓ dramatically | No – large primary deficits remain | ❌ |
| Reduce overall fiscal deficit | Deficit dramatically reduced / fiscal balance achieved | Debt dynamics improve | Federal deficit remains very large | ❌ |
| Reduce new borrowing requirements | Financing needs sharply reduced | Debt accumulation slows | Treasury continues issuing substantial amounts of new debt | ❌ |
| End monetary deficit financing | Central-bank financing of the Treasury sharply curtailed | Money creation pressure ↓ | Fed does not directly finance Treasury deficits; institutional framework differs | ⚠️ N/A / Mixed |
| Strengthen monetary discipline | BCRA balance sheet cleaned up and fiscal dominance reduced | Inflation expectations ↓ | Political pressure for lower interest rates while fiscal deficits remain high | ❌ |
| Fight inflation through fiscal restraint | Fiscal consolidation became a core anti-inflation tool | Inflation ↓ dramatically | Inflation reduction is a stated objective, but fiscal policy remains comparatively expansionary | ❌ |
| Deregulation | Extensive deregulation across the economy | Competition and potential productivity ↑ | Extensive deregulation across multiple sectors | ✅ |
| Reduce trade barriers | Import restrictions and controls partially liberalized | Competition and economic openness ↑ | Tariffs expanded significantly | ❌ |
| Reduce import tariffs | Tariffs/restrictions reduced in several areas | Import competition ↑, domestic prices ↓ | Tariffs used extensively as an economic-policy instrument | ❌ |
| Privatization / reduce state ownership | Privatizations and concessions pursued | State liabilities and operational burden ↓ | Some privatization/asset-sale initiatives, but less central to policy | ⚠️ Mixed |
| Tie spending to available revenue | Zero-deficit principle is a central policy objective | Fiscal discipline ↑ | No comparable binding balanced-budget rule | ❌ |
| Stabilize / reduce Debt-to-GDP | Debt-to-GDP ratio fell sharply from crisis levels | Debt sustainability ↑ | Federal debt-to-GDP remains on a rising long-term trajectory | ❌ |
| Supply-side growth reforms | Deregulation, liberalization and investment incentives | Potential growth ↑ | Deregulation, tax cuts and investment incentives, but the main beneficiaries are among upper incomes | ✅ |
| Accept short-term economic pain for fiscal consolidation | Explicit shock therapy; recession initially tolerated | Rapid macro adjustment | No comparable economy-wide austerity program | ❌ |
| Use fiscal policy to restore market confidence | Balanced budget and primary surplus used as credibility anchors | Sovereign risk premium ↓ | Growth and tax policy prioritized despite continued deficits | ❌ |
| Reduce fiscal dominance over monetary policy | Treasury financing needs reduced, lowering pressure on BCRA | Monetary credibility ↑ | Large Treasury financing requirements continue | ❌ |
| Build foreign-exchange reserves | Reserve accumulation is a key stabilization objective | External debt-service capacity ↑ | Not directly comparable because USD is the global reserve currency | ⚠️ N/A |
| Use external financing during transition | IMF and multilateral financing provide liquidity during adjustment | Short-term liquidity ↑ but gross debt not automatically ↓ | Treasury has deep domestic/global USD funding markets | ⚠️ N/A |
| Structural objective | Smaller state + balanced budget + monetary stability | Lower inflation and sustainable debt dynamics | Smaller regulatory state + lower taxes + protectionist trade policy, while tolerating large deficits | ❌ |
High debt and high interest rates are a fundamentally dangerous combination. An economy can sustain very large debt when financing costs are low, and it can tolerate high interest rates when debt levels are modest. But when both remain elevated at the same time, the arithmetic becomes increasingly unforgiving. Interest expenses consume a growing share of government revenues, deficits widen, refinancing needs increase, and eventually fiscal policy begins to crowd out productive investment and economic growth.
The chart may show one of the most consequential macroeconomic regime changes of our time. For decades, U.S. Treasury yields moved within a persistent secular downtrend. Falling inflation, globalization, favorable demographics and increasingly accommodative monetary policy allowed governments, households and corporations to refinance debt at progressively lower interest rates.
That environment was highly supportive for both debt accumulation and asset prices. Governments could run larger deficits without immediately suffering from rising interest expenses. Corporations could borrow cheaply, households benefited from falling mortgage rates, and declining discount rates continuously increased the present value of equities, bonds and real estate. The great bull market in financial assets was therefore not independent of falling yields — it was one of its major beneficiaries.
That regime appears to have changed.
The post-pandemic inflation shock pushed Treasury yields decisively above their multi-decade declining trend. More importantly, several forces that suppressed inflation for decades are now weakening or reversing: globalization is fragmenting, tariffs are rising, supply chains are being regionalized, defense spending is increasing, labor is becoming more expensive, energy security requires additional investment, and large AI and infrastructure investment is creating new demand for capital and electricity.
If inflation and nominal interest rates remain structurally higher, the consequences extend far beyond the bond market.
| Area | Disinflationary / Falling-Rate Regime | Higher-Inflation / Higher-Rate Regime |
|---|---|---|
| Government Debt | 🟢 Cheap refinancing | 🔴 Refinancing increasingly expensive |
| Fiscal Deficits | 🟢 Easier to finance | 🔴 Interest costs compound deficits |
| Central Banks | 🟢 Greater freedom to cut rates / use QE | 🔴 Inflation limits monetary flexibility |
| Government Bonds | 🟢 Falling yields support bond prices | 🔴 Higher yields create duration risk |
| Growth Stocks | 🟢 Falling discount rates support valuations | 🔴 Higher discount rates pressure multiples |
| Value Stocks | 🟡 Often overshadowed by long-duration growth | 🟢 Potential relative advantage |
| Banks | 🟡 Low rates can squeeze margins | 🟢 Higher margins, unless credit losses rise |
| Real Estate | 🟢 Cheap leverage supports valuations | 🔴 Higher financing costs pressure valuations |
| Gold | 🟡 Less demand for monetary/inflation protection | 🟢 Can benefit from inflation and fiscal uncertainty |
| Commodities | 🟡 Weak inflationary backdrop | 🟢 Potential structural beneficiary |
| Cash / T-Bills | 🔴 Very low real and nominal returns | 🟢 Attractive yields with little duration risk |
| Private Equity | 🟢 Cheap leverage supports returns and valuations | 🔴 Expensive leverage pressures returns |
| Economy | 🟢 Credit expansion and investment relatively easy | 🔴 Higher hurdle rates constrain investment and consumption |
Aggressive government debt issuance typically happens during a recession in order to restart the economy. The counterintuitive reality is that despite excessive government spending we see a late-cycle labor market, late-cycle housing cycle, economic slowdown and rising inflation.
The fiscal consequences may be the most important. When government debt is low and yields are falling, higher debt can remain manageable for a surprisingly long time. But once debt-to-GDP is already around 100% and refinancing rates rise, the mathematics change.
Suppose the effective interest rate on government debt eventually rises from 2% to 4%. With debt around 100% of GDP, the steady-state interest burden ultimately increases by roughly 2% of GDP. For the United States, that represents hundreds of billions of dollars of additional annual expenditure without providing a single additional road, teacher, soldier or social benefit. This creates a potentially dangerous feedback loop:
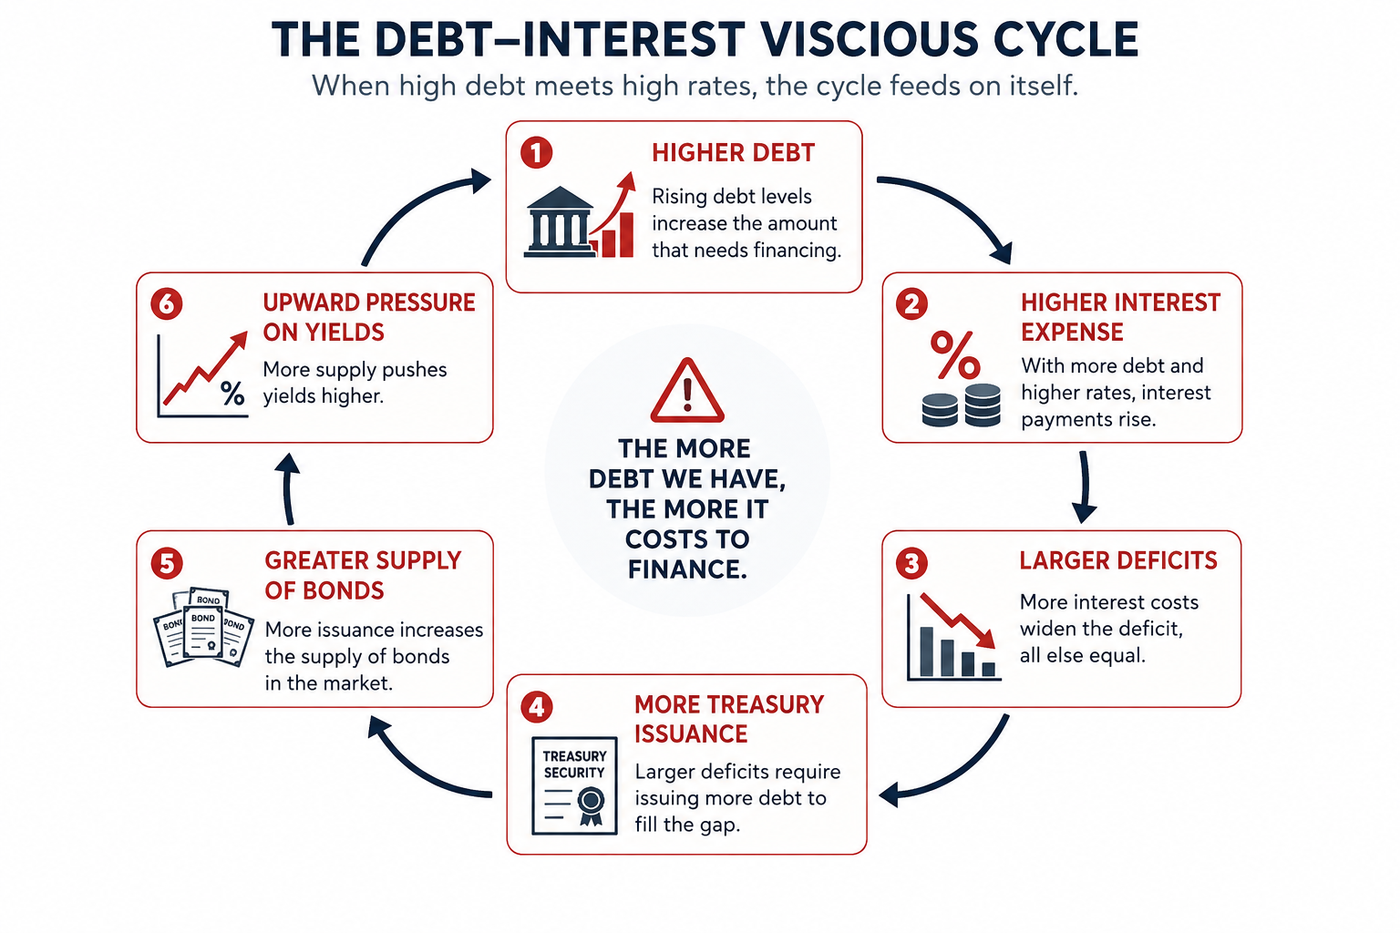
The debt-interest vicious cycle
That does not mean this loop automatically becomes explosive. Nominal GDP growth, inflation, demand for Treasuries, maturity structure and monetary policy all matter. But the margin for fiscal error becomes much smaller.
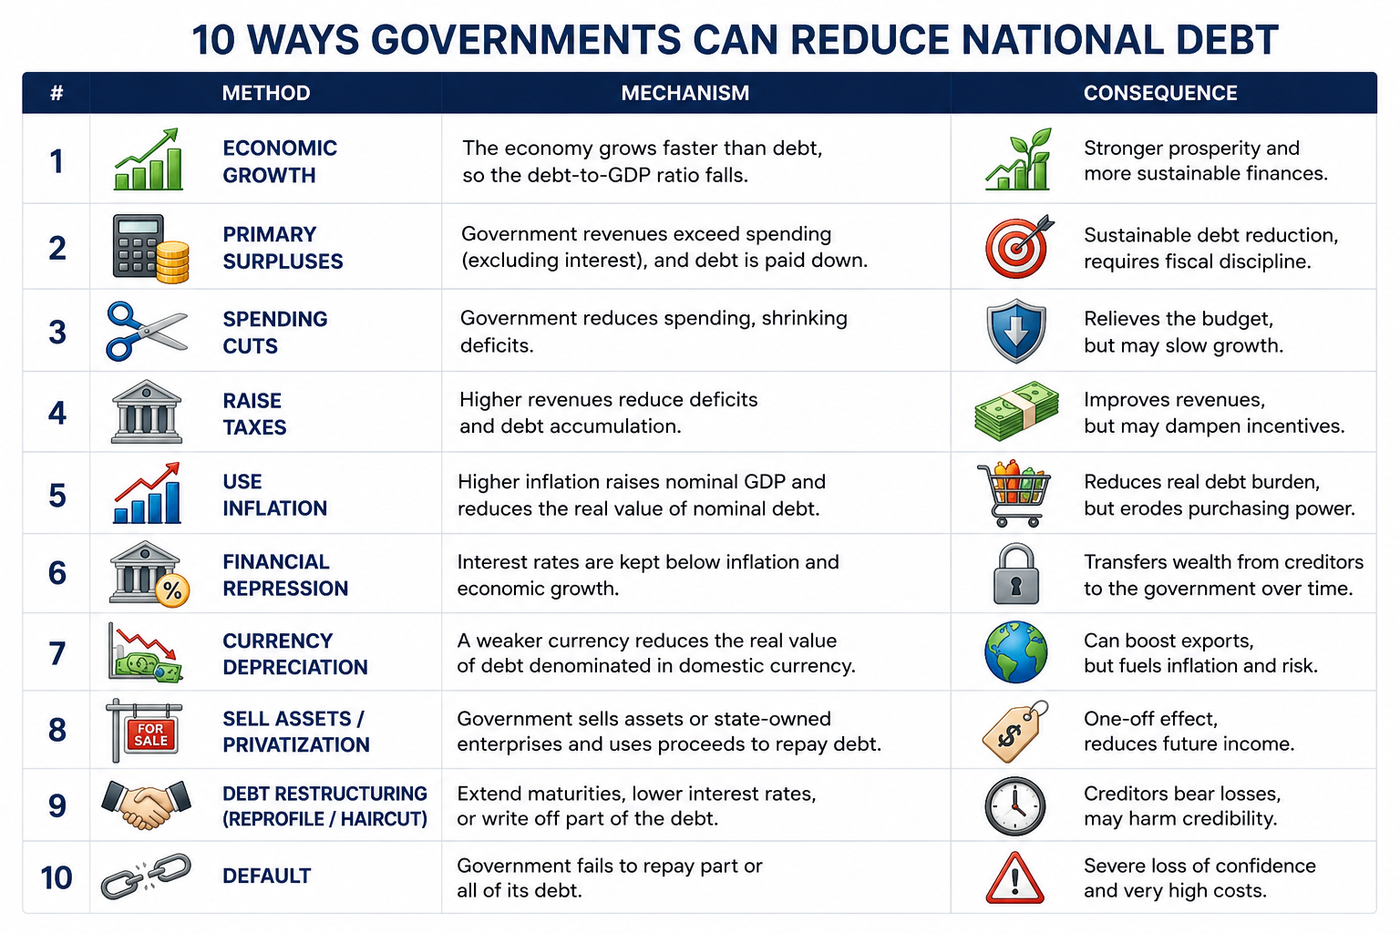
10 ways governments can reduce national debt
United States: The U.S. is primarily trying to outgrow and gradually dilute its debt burden rather than pay it down. Persistent deficits continue, while inflation and potential dollar depreciation can reduce the real burden of nominal debt. At the same time, the Treasury has expanded its Treasury buyback program, allowing it to buy older securities across the curve, while substantial short-term funding through Treasury bills changes the maturity composition of government debt. Fed operations can separately influence liquidity and the short end of the yield curve (Federal Reserve). In our terminology, the combination of “issue short, buy long” plus supportive Fed liquidity operations is what we call Operation TACO. It resembles a form of financial repression or duration management, although it is not formal Yield Curve Control and Treasury buybacks cannot directly dictate long-term yields.
Argentina: Milei is pursuing almost the opposite strategy: cut spending, generate primary surpluses, reduce monetary financing and stabilize inflation, while attempting to encourage private investment and privatization. Argentina moved from persistent primary deficits to fiscal surpluses under Milei (IMF – Argentina 2026 Article IV Consultation). Instead of relying on inflation and ever-growing deficits to manage the debt burden, the strategy is essentially to stop creating the fiscal problem first — and then use economic growth to reduce debt relative to GDP.
We already noted the historical shift from a disinflationary regime (2000 until 2020) back to an inflationary environment. Inflation often tends to materialize in waves, such as in the 1970s.
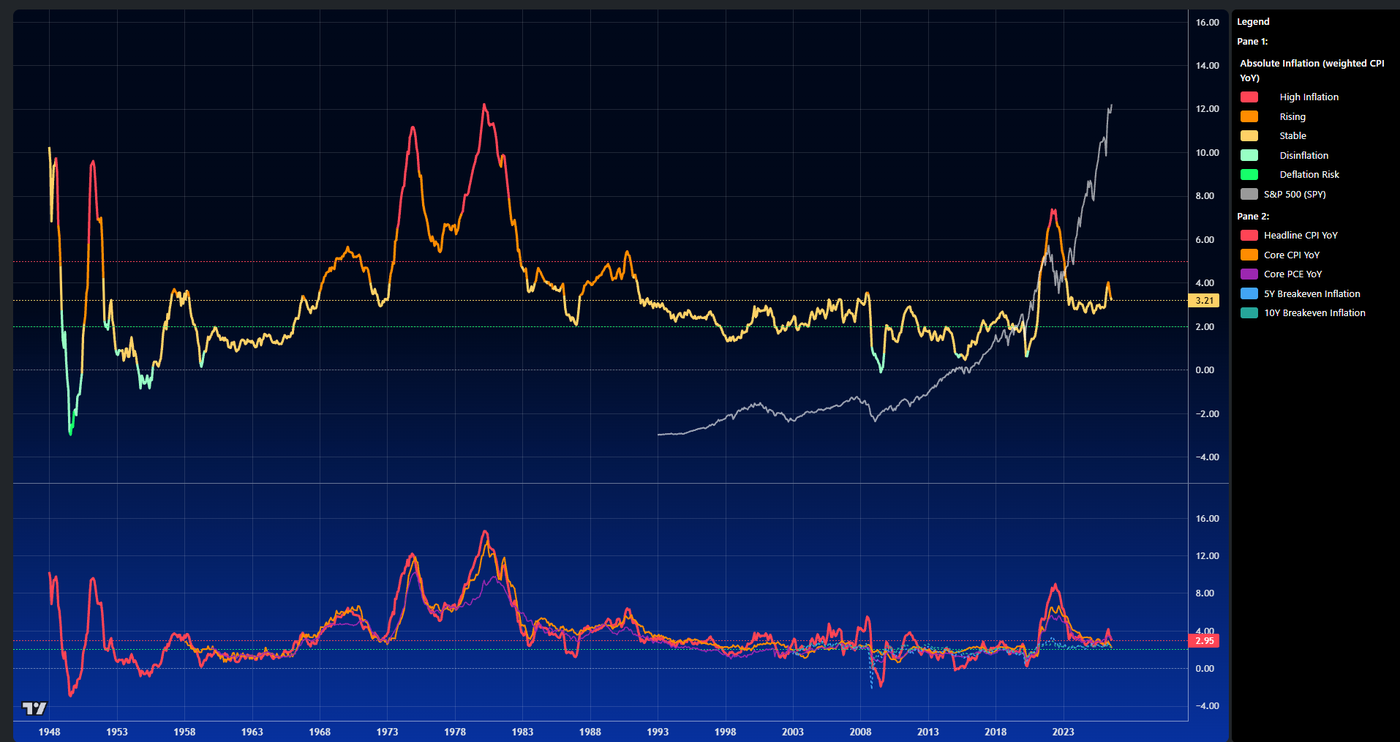
Inflation tends to come in waves. The last inflation cluster was the 1970s, followed by decades of low inflation and deflationary periods, until 2022 when the first wave hit.
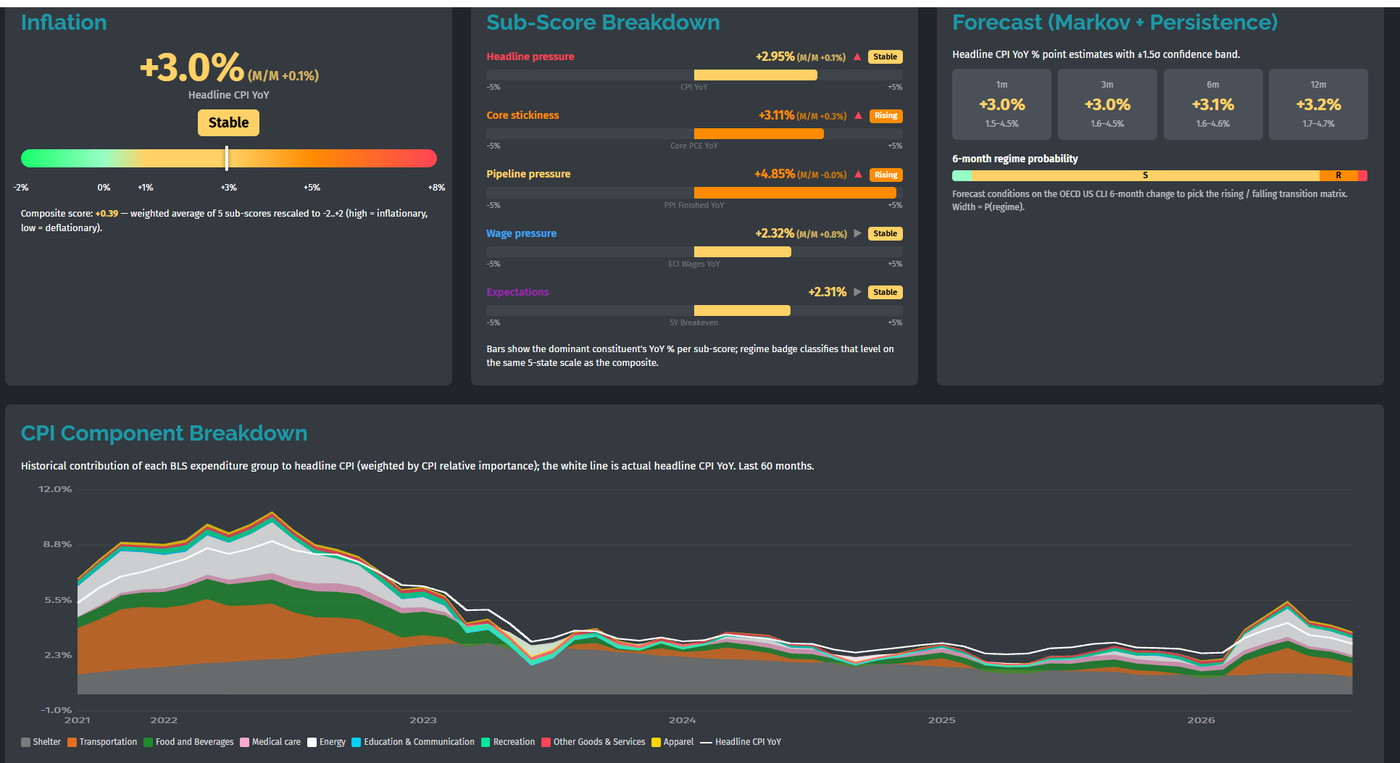
Markets in Vitro inflation analysis
The Markets in Vitro model finds stable elevated inflation of 3%, with a likely increase to 3.2% within the coming 12 months.
The yield curve evolution in the USA over the past year shows a flattening on the short end and a rise on the long end.
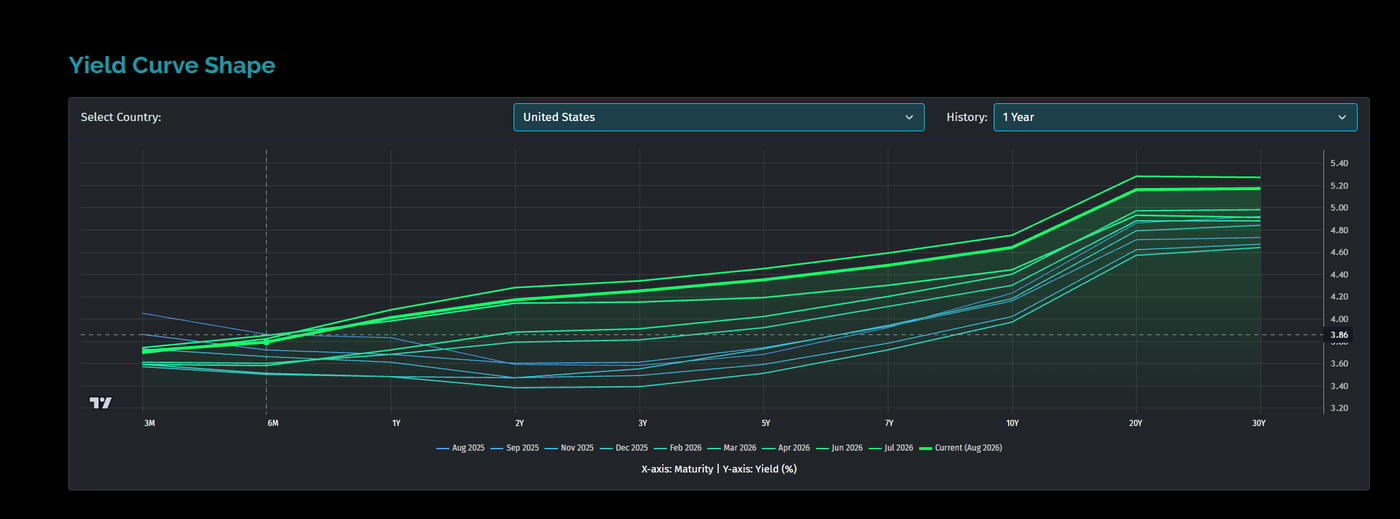
USA – Yield Curve
Contrary to repeated claims by President Trump that the Federal Reserve could simply lower interest rates across the economy, the Fed directly controls only the very short end of the yield curve. Its primary policy rate, the federal funds rate, is the overnight rate at which depository institutions lend reserve balances to one another (Federal Reserve). Changes in this rate strongly influence other short-term rates, including Treasury bills, but the Fed does not directly set long-term Treasury yields.
Longer-term Treasury yields are determined in financial markets and can broadly be decomposed into the market’s expected path of future short-term interest rates plus a term premium — the additional compensation investors demand for bearing interest-rate and duration risk over many years (Federal Reserve Bank of New York). Fiscal deficits, Treasury supply, inflation uncertainty and concerns about long-term debt sustainability can therefore put upward pressure on long-term yields even while the Fed is cutting its policy rate.
This became particularly relevant in 2025. In May, Moody’s downgraded the U.S. sovereign credit rating from Aaa to Aa1, citing the deterioration in U.S. fiscal strength (Moody’s Ratings). Measures of the Treasury term premium also remained elevated by post-2010 standards, indicating that investors continued to demand meaningful compensation for holding long-duration government debt (Federal Reserve – Financial Stability Report, November 2025).
In other words: the U.S. can still borrow — but investors increasingly want to be paid more for the risk.
The divergence became visible in the yield curve itself: as the Federal Reserve lowered short-term rates, long-term Treasury yields did not necessarily follow by the same magnitude (Federal Reserve H.15 Interest Rate Data). This illustrates the fundamental limitation of monetary policy:
The Fed can cut short-term rates. It cannot guarantee lower long-term borrowing costs for the U.S. government. The bond market ultimately has a vote.
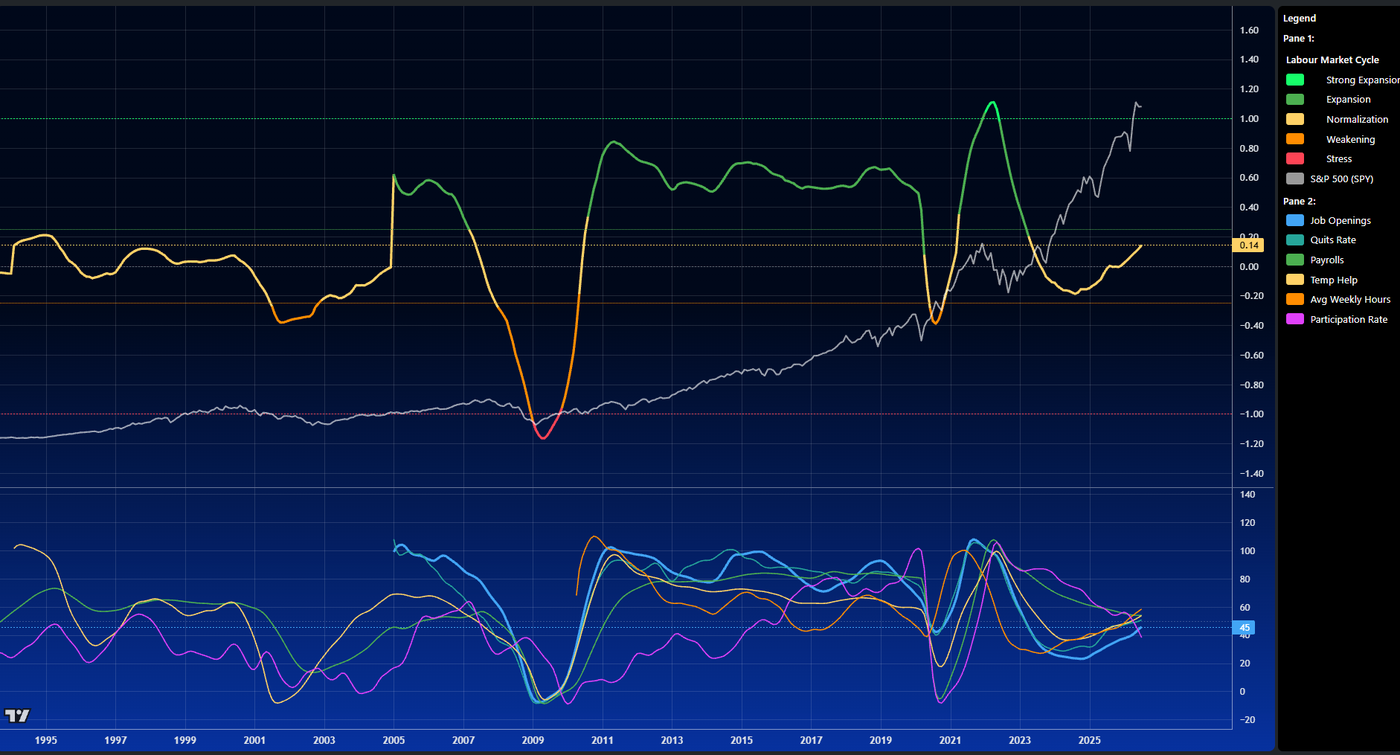
Labour market is weak and participation rate has started to drop
The U.S. labor market appears to be moving from late-cycle cooling toward the early stages of contraction. Job creation has slowed sharply, with nonfarm payrolls declining by 23,000 in July 2026 and previous months revised substantially lower, while unemployment remained at 4.1% (U.S. Bureau of Labor Statistics – Employment Situation). Hiring and voluntary quits also remain subdued, suggesting that workers and employers have become increasingly cautious, although layoffs are still relatively contained (U.S. Bureau of Labor Statistics – JOLTS). This points to a “low-hire, low-fire” labor market rather than a full recessionary employment cycle: companies are reluctant to expand their workforce, but widespread layoffs have not yet begun. A sustained increase in layoffs combined with several months of declining payrolls would provide much stronger evidence that the U.S. labor market has entered outright contraction.
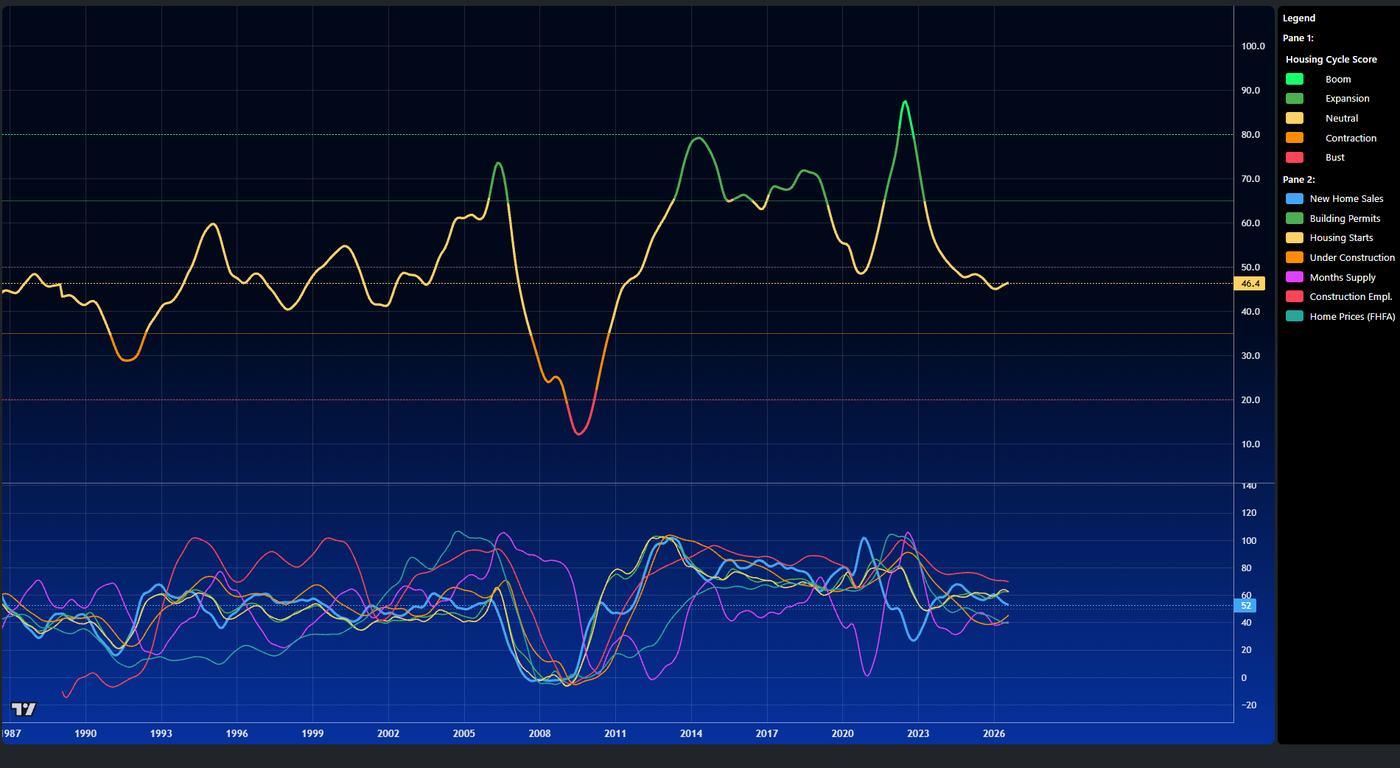
The housing cycle and its individual constituents
The U.S. housing market is currently best described as a late-cycle, highly fragmented slowdown rather than a uniform national housing recession. High mortgage rates and stretched affordability continue to suppress transactions and purchasing power (Federal Reserve – Mortgage Rates), while home prices remain historically elevated relative to household incomes (Federal Reserve – House Price Index). The adjustment is increasingly K-shaped: wealthier households and affluent areas tend to be more resilient because owners generally have greater equity, financial assets and less dependence on new mortgage financing, while lower- and middle-income buyers face severe affordability constraints (Federal Reserve – Distribution of Household Wealth). Regional differences are equally important: markets with rapidly expanding inventories, particularly parts of the South and Sun Belt, face greater price pressure, while supply-constrained markets can remain comparatively resilient (Realtor.com – Housing Inventory). In cycle terms, the U.S. therefore sits somewhere between late expansion and correction, but beneath the national averages two housing markets increasingly coexist: an asset-rich market that remains relatively resilient and an affordability-constrained market already behaving much more like a downturn.
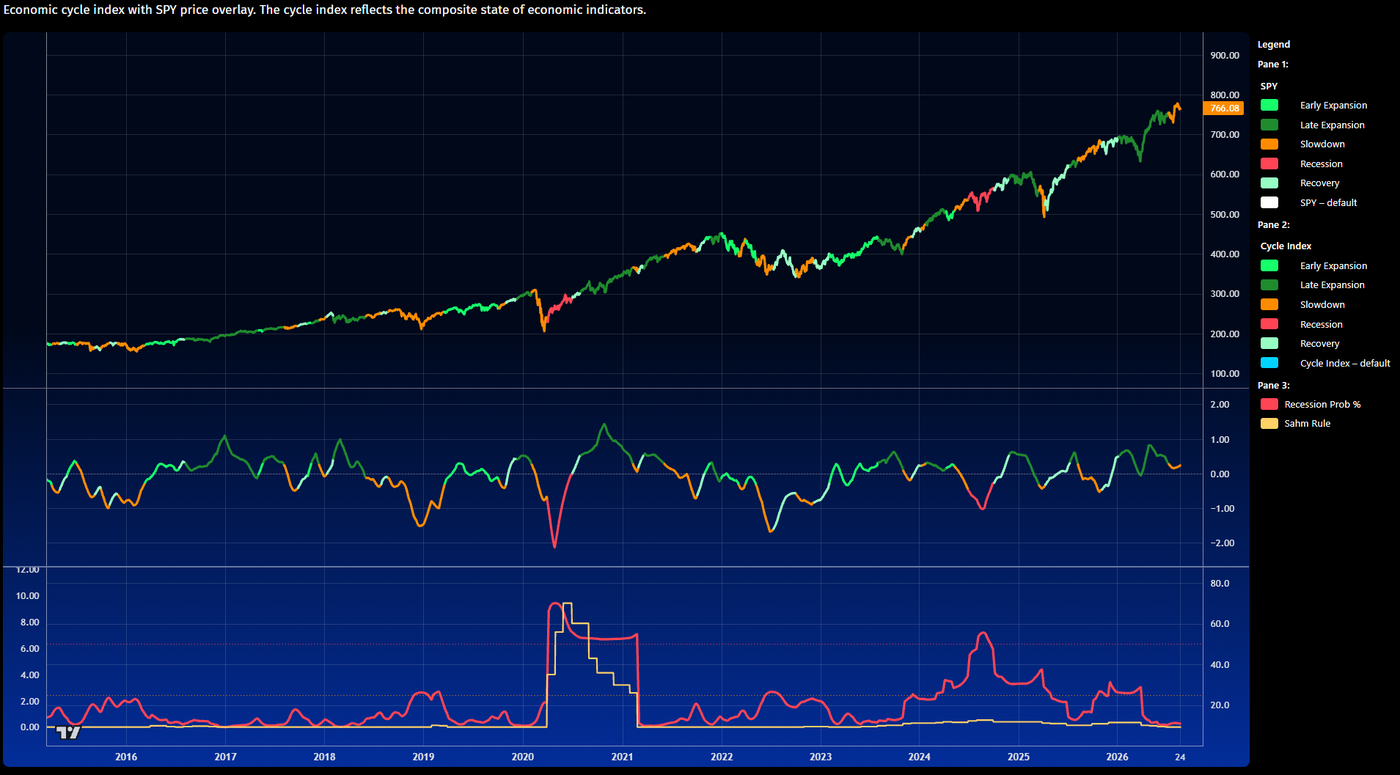
The economic cycle and recession risk. We are in the late-cycle phase
The U.S. economy currently looks like a late-cycle expansion that is increasingly K-shaped, rather than a broad-based recession. Headline GDP can remain positive while the underlying economy weakens: the labor market has moved into a low-hire, low-fire environment, manufacturing and other cyclical sectors remain under pressure, and high interest rates are increasingly constraining housing, credit-sensitive businesses and lower-income consumers (BLS – Employment Situation, Federal Reserve – Industrial Production, Federal Reserve – Beige Book). At the same time, AI-related investment, technology spending and affluent consumers supported by elevated asset values continue to provide important growth pockets, while lower-income households face much greater pressure from housing costs, debt servicing and accumulated inflation (BEA – GDP, Federal Reserve – Distribution of Household Wealth). In classic cycle terms, the U.S. therefore appears to be past the broad expansion phase and somewhere between late-cycle slowdown and contraction risk: the aggregate economy is still growing, but underneath the headline numbers the divide between asset-rich sectors and households and the rest of the economy is becoming increasingly important.
The U.S. economy is increasingly two-speed: much of the investment momentum is concentrated in AI, semiconductors, software, data centers and related power infrastructure, while traditional sectors remain considerably weaker. The Federal Reserve estimates that AI-related capital expenditure contributed roughly 1.36 percentage points to annualized GDP growth in Q1 2026, while noting weak investment outside these areas (Federal Reserve). With overall GDP growth slowing, the economy is becoming increasingly dependent on the AI investment boom as a major marginal growth engine (BEA).
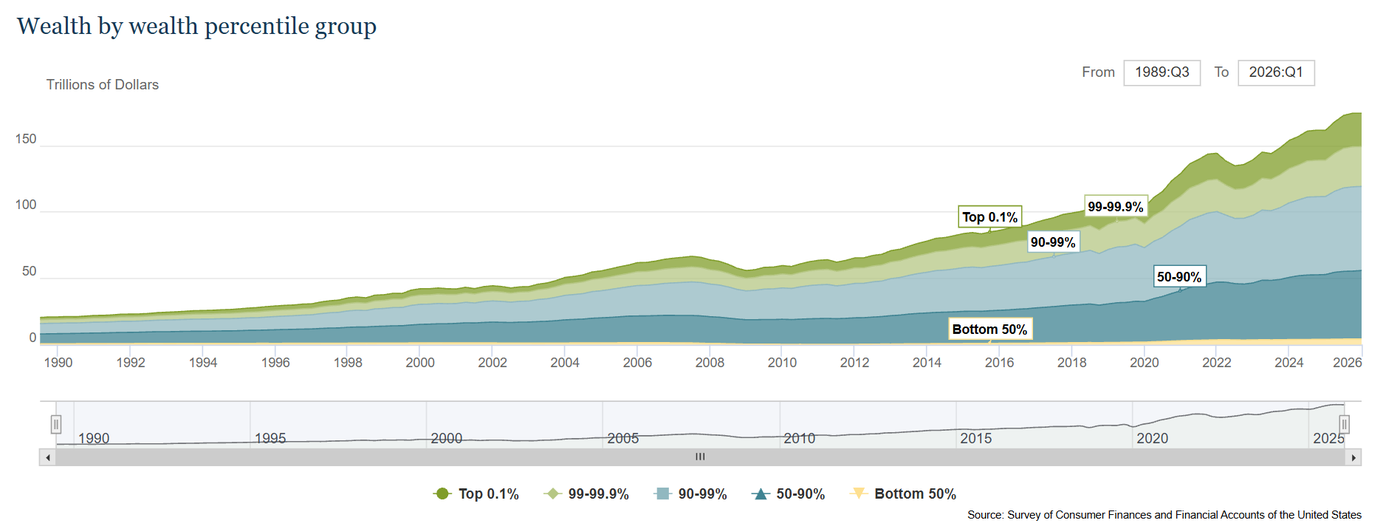
Wealth by wealth percentile group: Distributions by generation are defined by birth year as follows: Silent and Earlier=born before 1946, Baby Boomer=born 1946–1964, Gen X=born 1965–1980, and Millennial=born 1981 or later.
Half of America is almost invisible on the wealth chart. The bottom 50% owns only a tiny fraction of total U.S. household wealth, while even the next 40% — broadly representing the middle of the wealth distribution — owns less than the richest 10% alone (Federal Reserve – Distributional Financial Accounts). America has created a large amount of wealth, but much of that wealth creation has accumulated at the top.
And this wealth divide is increasingly spilling over into consumer spending. Bank of America now describes a clear K-shaped consumer, with spending and wage growth among higher-income households outperforming both lower- and middle-income households. In April 2026, lower- and middle-income households were already pulling back on discretionary spending while higher-income consumers continued to power forward (Bank of America Institute – Consumer Checkpoint). The effect is reinforced by the stock market: Bank of America finds that discretionary spending by the top 5% increasingly outperforms middle-income households when the S&P 500 rises, consistent with a strong wealth effect (Bank of America Institute – Tale of Two Wallets). Estimates cited by the Federal Reserve Bank of Minneapolis suggest that the top 10% now account for more than 45% of U.S. consumer spending, while the bottom 60% account for only about 23% — although the Fed cautions that these Moody’s estimates are model-based rather than direct measurements (Federal Reserve Bank of Minneapolis).
This creates an unusual economy: headline consumption can remain strong even while the financial position of much of the population deteriorates. Increasingly, the wealthy are carrying the American consumer.
For forty years, falling interest rates provided a large tailwind for asset prices. If that secular decline is over, investors can no longer rely on multiple expansion. Returns increasingly have to come from earnings, productivity and real economic growth. This makes the AI boom crucial: if AI delivers a genuine productivity revolution, stronger growth could help the U.S. carry higher rates and debt. If not, the combination becomes uncomfortable: high debt + high rates + high valuations + insufficient growth.
The problem is that U.S. growth is increasingly K-shaped. AI, semiconductors, data centers and wealthy asset owners remain strong, while much of the broader economy is weaker. The top 10% now account for more than 45% of consumer spending, according to estimates reviewed by the Federal Reserve Bank of Minneapolis. This means headline consumption can remain strong even while middle- and lower-income households come under pressure. Asset inflation cannot permanently substitute for broad-based growth.
This brings us back to Milei versus America. Argentina is attacking the numerator: stop adding debt. The U.S. is betting on the denominator: grow fast enough to carry it. Milei accepted short-term pain to restore fiscal credibility. Washington continues running large deficits while relying on growth, inflation and its exceptional financing capacity — increasingly complemented by Treasury duration management and monetary support, what we call Operation TACO. Neither strategy is guaranteed to succeed. But the contrast is clear:
Argentina is trying to rebuild credibility after decades of spending it. The United States is testing how much of its extraordinary credibility it can afford to spend.
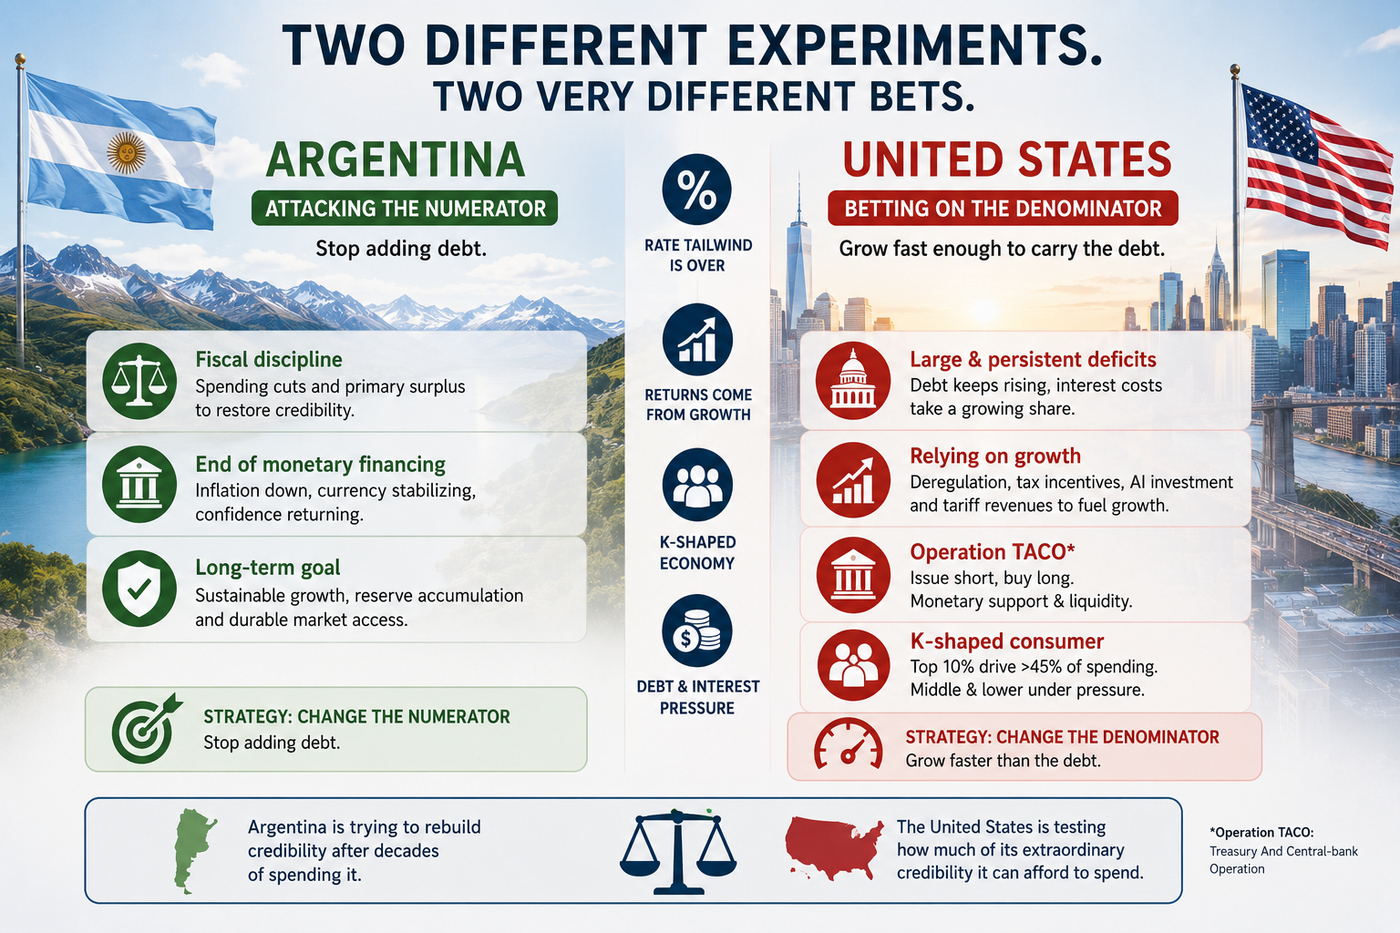
Two similar but different approaches: Argentina vs. USA
Reforms aim to create a more open and competitive economy
IMF – Argentina: Request for an Extended Arrangement Under the Extended Fund Facility (2025)
Higher tariffs reduced projected deficits by an estimated $3.0 trillion
Debt held by the public is higher as a result of the legislation
CBO – Updated Projections of the Budgetary Effects of Tariffs
Lower borrowing and interest costs increased the estimated total deficit reduction to about $3.0 trillion over 2025–2035
CBO – Budgetary and Economic Effects of the 2025 Tariff Increases
Estimated inflation effect: approximately +0.4 percentage points annually in 2025 and 2026