What if you could see where billions of institutional dollars are quietly changing hands?
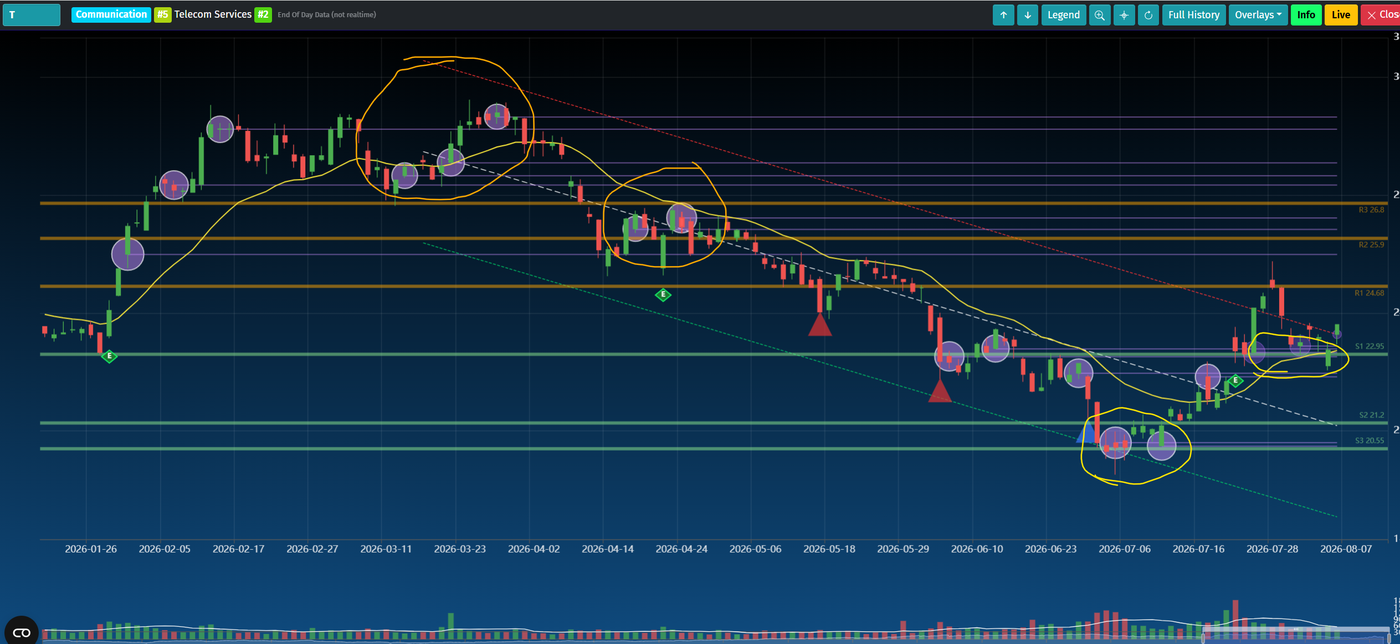
Analysis chart of AT&T (T) — recent dark pool cluster at key support levels
More than half of all U.S. equity trading now takes place off-exchange, away from the public lit order book. But contrary to popular belief, dark pools aren’t secret venues for manipulation—they are ATSs (Alternative Trading Systems) designed to help large institutions execute block trades efficiently while minimizing market impact and information leakage.
In this video, I explain how dark pools actually work, how trades are reported to the FINRA TRF with the required post-trade transparency delay, why institutions use them, and—most importantly—what dark pool prints can (and cannot) tell us as traders. You’ll also learn why clusters of institutional activity often appear around major support and resistance levels, how to interpret price action after large prints, and how to separate useful signals from common misconceptions.
If you want to better understand institutional order flow, modern market structure, and the hidden mechanics behind today’s equity markets, this is a video you won’t want to miss.