Market Analysis
The SP500 Indicator flipped back to red — the second time in just five sessions. Ahead of Nvidia’s recent announcement, there had been clear signs of accumulation. On September 22, Nvidia unveiled a record \$30 billion share buyback program and pledged to expand its AI infrastructure spending (Reuters). The stock initially surged, lifting both the S&P 500 and the Nasdaq on a strong green candle. Yesterday, however, this move was entirely reversed, forming what technical analysts refer to as a Tweezer Top pattern.
A Tweezer Top, consisting of a long green candle immediately followed by a long red candle at or near the same high, is considered a moderate reversal signal. Historical testing (Bulkowski, Encyclopedia of Candlestick Charts) shows a follow-through probability of around 55–60%. Importantly, the pattern gains credibility if the following session confirms the reversal with additional downside. When confirmed, median declines often span 1–2 daily ATRs, with deeper pullbacks occasionally stretching toward 3–5 ATRs (roughly 5–10% in the S&P 500, so the 6500 support level is in the cards).
In today’s setup, confirmation would likely open the door for a retest of the 6,450–6,500 support zone, with risk of a deeper move toward 6,300 if selling accelerates. Without confirmation, however, the pattern may fail, and the broader uptrend could quickly reassert itself.
Treasury Auctions: Liquidity and Political Risk
One factor that will be particularly interesting in the days ahead are the upcoming U.S. Treasury auctions. If investors are shaken out of equities by fear and volatility, that capital could flow into government debt — just as a wave of new issuance is set to hit the market: a staggering amount of 392 Billion USD is scheduled to auction today and tomorrow, according to the TreasuryDirect Upcoming Auctions, with most of the auctions exceeding the typical auction volumes of $10–30 billion each (shorter maturities show often larger volumes ofup to 100 billion).
Treasury Borrowing Outlook Q4 2025
According to the U.S. Treasury’s latest borrowing estimates, net privately-held marketable borrowing for the quarter October–December 2025 is projected at $590 billion, assuming a year-end cash balance of $850 billion. This total includes both coupon securities (Notes and Bonds) and short-term Bills, underscoring the scale of upcoming issuance.
The Treasury’s presentation to the TBAC notes that issuance will continue to rely heavily on short-term Bills to maintain flexibility, while coupon auction sizes are expected to remain broadly steady. This sets the stage for another quarter of elevated supply, where market demand and yield dynamics will play a critical role in determining funding costs.
Suspicious Insider Transactions
Insider activity in the past week revealed several high-profile transactions, with a notable skew toward large SELL operations:
Largest Insider Sells
-
Magnetar Financial (10% Owner)
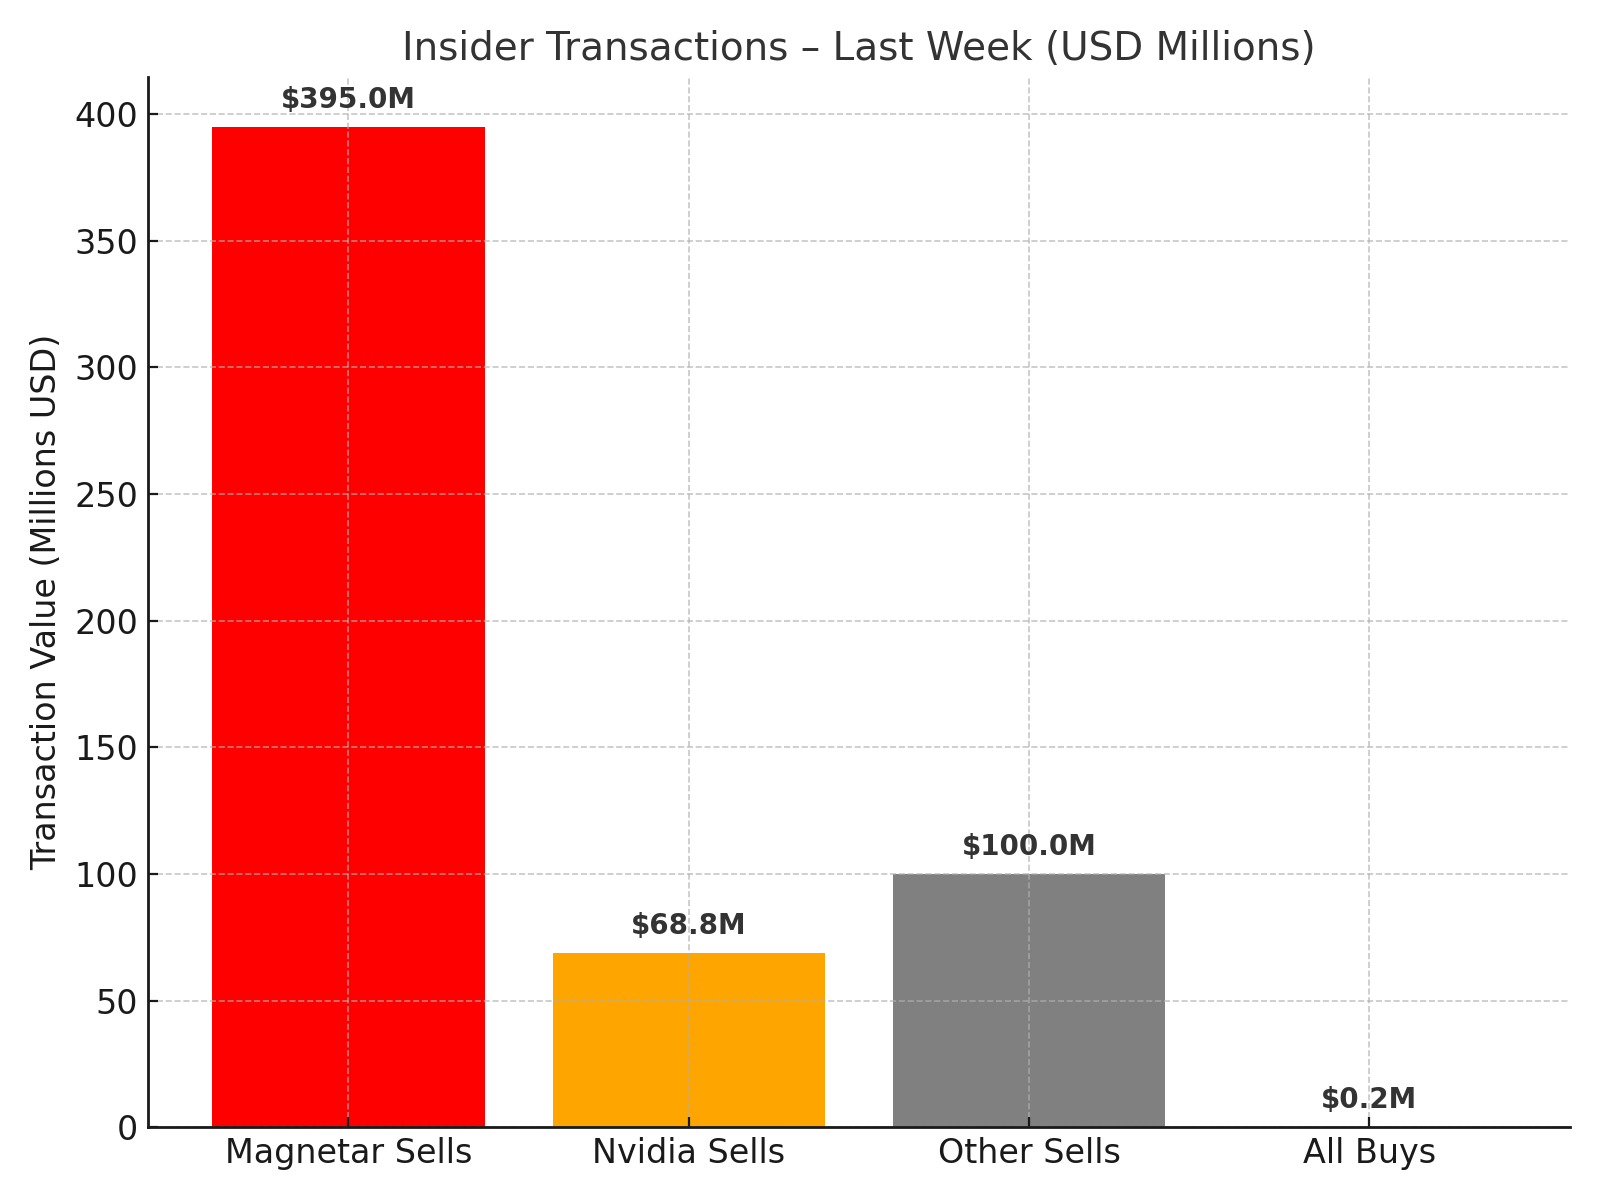
– Sold 1.27M shares @ $120.10 ($152.7M)
– Sold 1.15M shares @ $125.60 ($144.6M)
– Sold 734k shares @ $132.42 ($97.2M)
Total across transactions: $395M** -
Nvidia (NVDA)
– Mark A. Stevens (Director): 350k shares @ $176.39 ($61.7M)
– Persis Drell (Director): 40k shares @ $177.65 ($7.1M)
Combined: approx.$68.8M -
Other notable sales: additional insider disposals at Rocket Lab (RKLB) and Dell-related entities, each in the tens of millions USD.
Largest Insider Buys
- Global GP LLC (Insider Buy): 5k shares @ $49.63 ($250k)
- Other smaller purchases were recorded, but volumes remain marginal compared to the scale of insider selling.
Summary
The balance of insider activity last week shows massive selling pressure versus only token insider buying. Magnetar alone liquidated nearly \$400M, while Nvidia insiders disposed of almost \$70M worth of stock. In contrast, reported insider buys barely crossed a few hundred thousand USD.
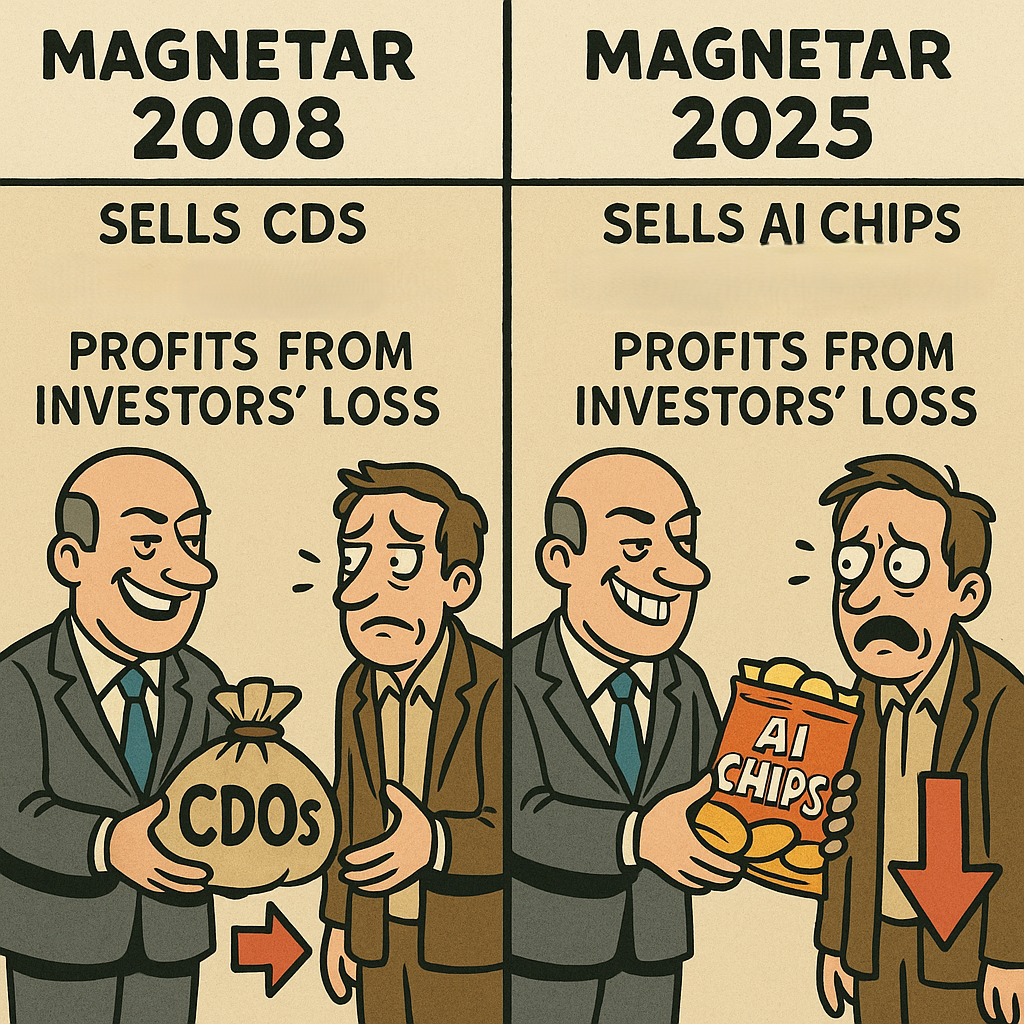
Interpretation: Insider flows currently reflect caution at the top — large stakeholders are taking chips off the table, while few are stepping in aggressively on the buy side. For investors, this divergence can be viewed as a bearish sentiment indicator, particularly in high-profile names like Nvidia. We remember the parallels of Magnetar’s short on CDOs in 2007 (Great Financial Crisis) and Magnetar’s short on Nvidia now, 2025