The First Farm Crisis: 2018–2019
The 2018–2019 farm crisis was triggered by a perfect storm of falling prices, rising costs, and geopolitical shocks.
The turning point came with the U.S.–China trade war, when Washington imposed tariffs on steel, aluminum, and a wide range of Chinese goods. Beijing retaliated by targeting U.S. agriculture — soybeans, pork, dairy, and corn — industries where China had been a top buyer. Soybeans were hit hardest: more than 30% of U.S. production was destined for China, and prices collapsed from nearly $10/bushel in early 2018 to below $8 by autumn (Reuters).
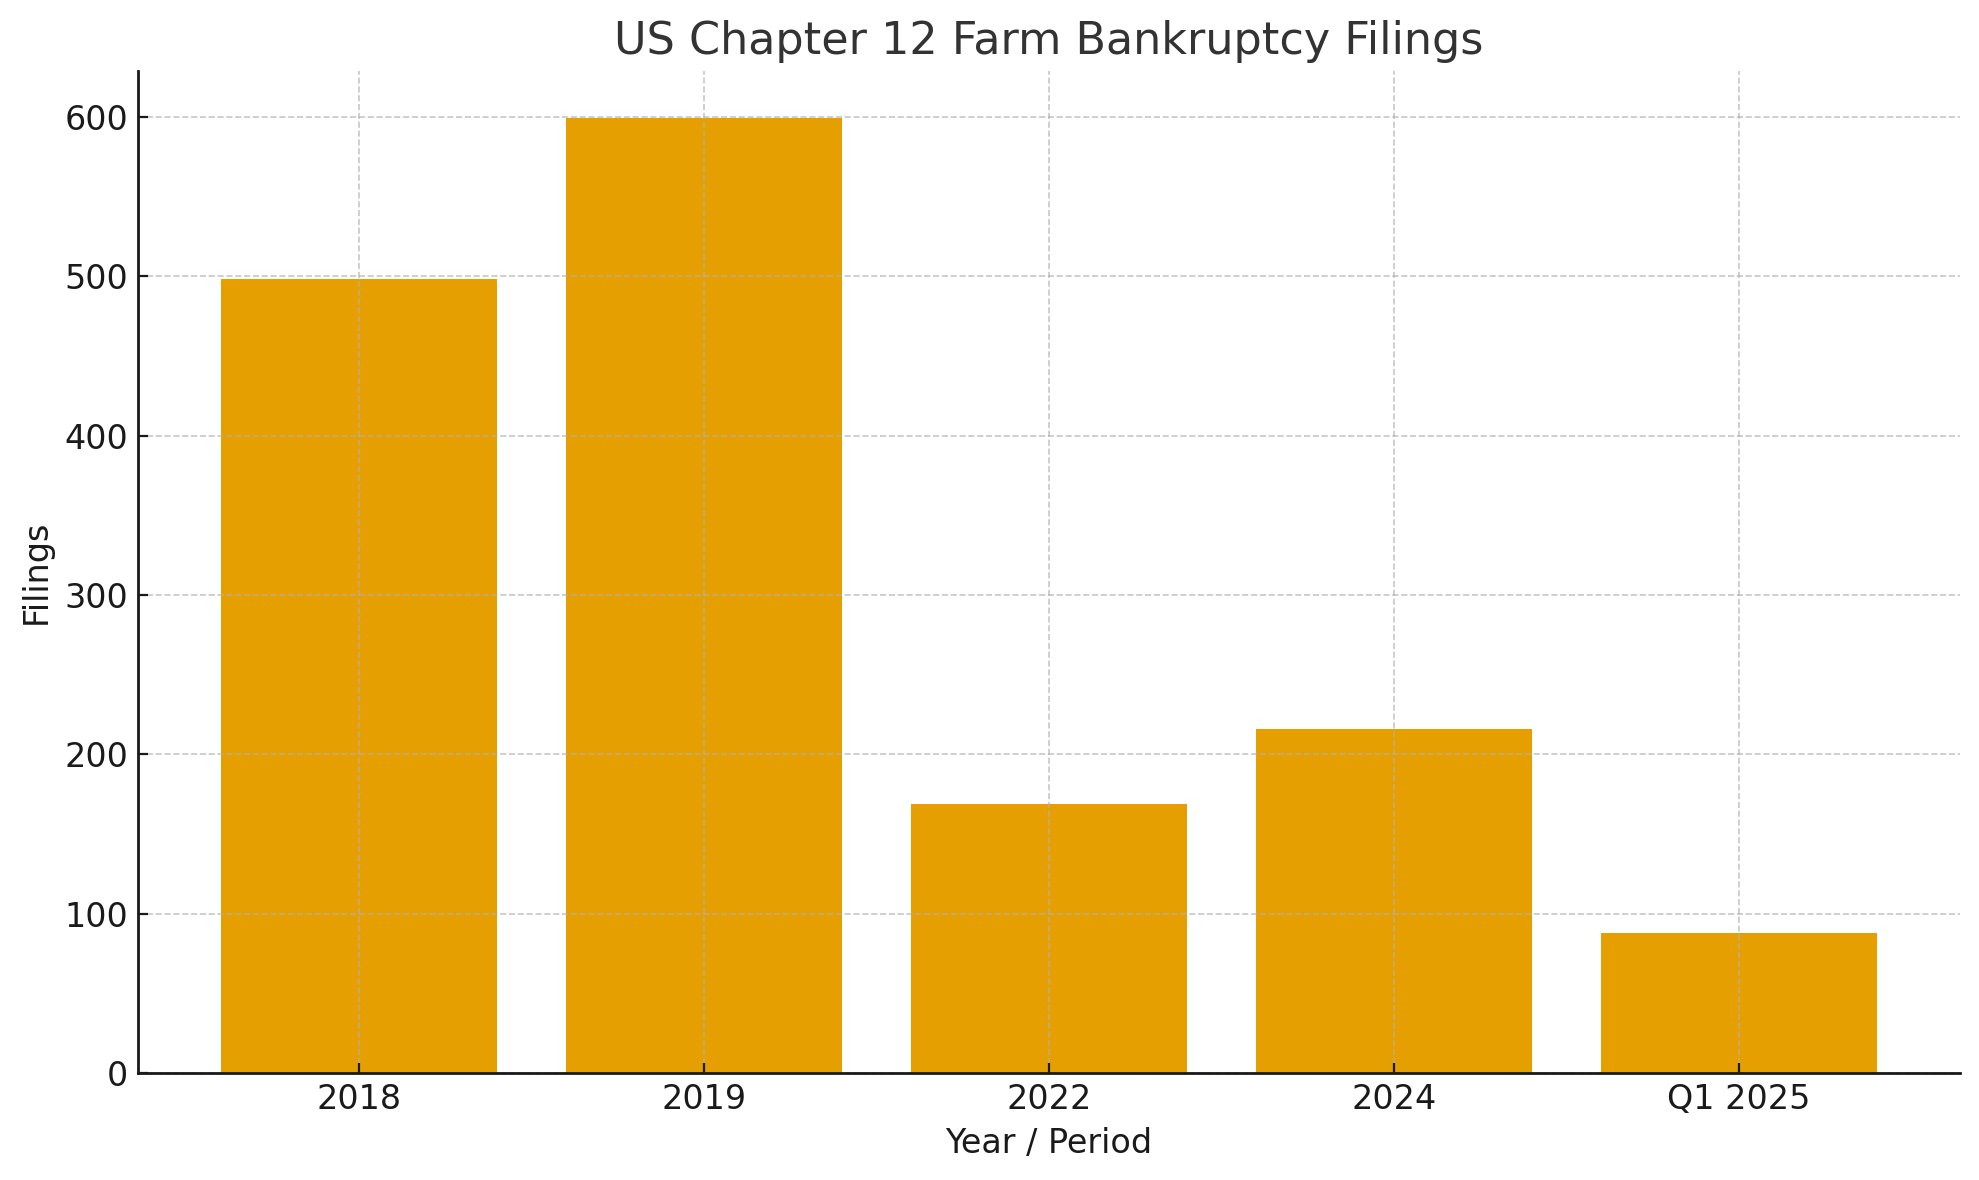
The trade war was not the only factor. Already before tariffs, commodity prices had been softening, and operating costs (diesel, fertilizer, seed) were rising. Farm debt had climbed to record levels, leaving many producers highly leveraged. Add in bouts of drought and flooding, and margins eroded further. The result was a spike in farm bankruptcies under Chapter 12, with 498 filings in 2018 and 599 in 2019 — the highest in a decade (Federal Reserve Bank of Minneapolis).
The Trump administration responded with the Market Facilitation Program (MFP), a multi-billion dollar subsidy aimed at offsetting losses from retaliatory tariffs (USDA). It provided temporary relief, but structural weaknesses — overreliance on exports, high leverage, and ongoing consolidation — remained.
The Current Crisis: 2024–2025
Fast-forward to today: U.S. agriculture is once again under stress. Chapter 12 filings totaled 216 in 2024, and in Q1 2025 alone there were 88 cases, nearly double the 45 of Q1 2024 (UAEX, Farm Policy News).
Parallels to 2018
- Commodity price weakness persists. Corn, soybeans, and wheat are trading near multi-year lows, just as in 2018.
- High input costs — fertilizer, seed, and energy — remain elevated, eroding margins.
- Trade frictions are again central, with China, the EU, and others deploying tariffs on U.S. farm goods in retaliation.
- Weather risks continue to aggravate financial stress, with floods and droughts hitting yields in key producing states.
Key Differences
- Interest rates: In 2025, farmers face much higher borrowing costs, with effective Fed funds near 4.33%, compared to a 2.5% upper bound in late 2018 (FRED). This makes refinancing and working capital far more expensive.
- Inflation backdrop: Today’s farm crisis unfolds against a backdrop of broad inflationary pressure, whereas 2018’s stress was more about sudden trade shocks.
- Depth of stress: Farmers have endured several years of squeezed income post-COVID, eroding financial reserves. By contrast, in 2018 many still had buffers before tariffs accelerated losses.
- Policy response: Aid programs in 2025 are slower to materialize and more politically contested than the rapid rollout of the MFP in 2018.
Sector Impact of Tariffs in 2025
The impact of tariffs is uneven. Sectors relying heavily on exports face the sharpest pain, while domestically oriented producers can even benefit from protection against imports.
- Net Losers: Soybeans (47% exported), cotton (88%), wheat (50%), rice (42%), and pork (30%) — all highly exposed to foreign markets.
- Mixed: Dairy (17% exports), beef (14%), poultry (12%) — exposed but with large domestic bases.
- Net Winners: Sugar (minimal exports, protected market), fresh vegetables and some fruits (import competition weakened).
- Tree Nuts (almonds, pistachios): Heavy export dependency (67% for almonds) makes them clear losers, echoing the 2018 pattern.
- Shrimp/Aquaculture: With the U.S. a net importer and exports <5%, domestic shrimp farms may benefit modestly from tariffs that raise the price of imports.
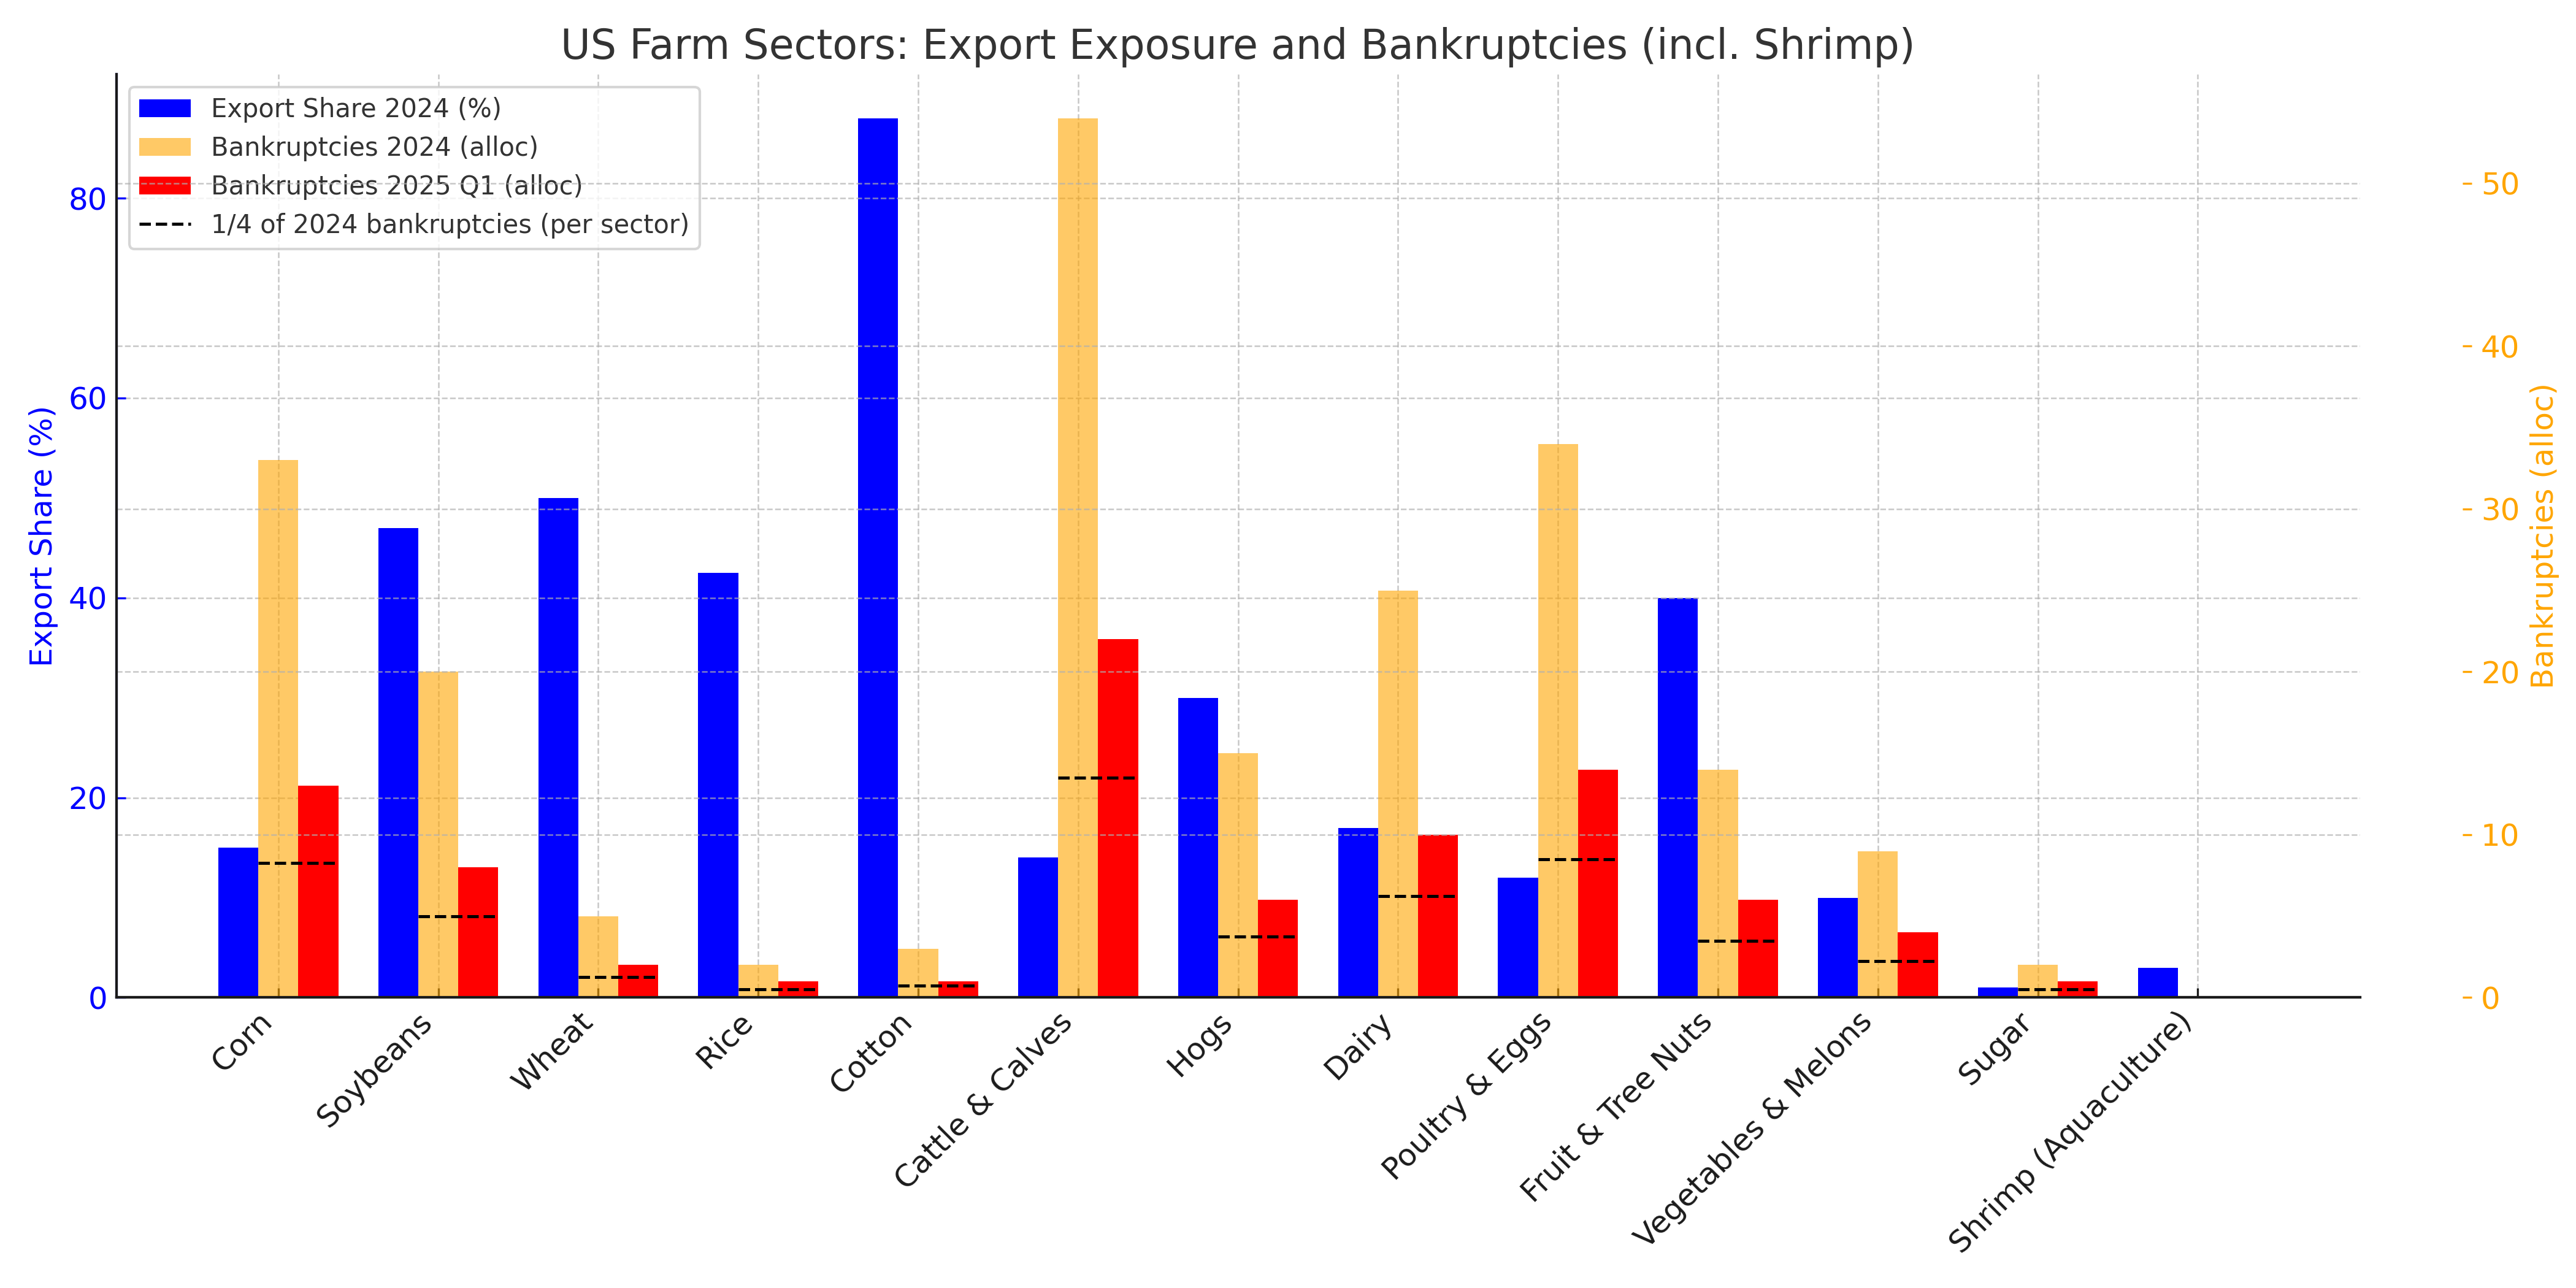
Note: Bankruptcy counts by sector are not officially published. The allocation above distributes the 2024 (216) and Q1 2025 (88) Chapter 12 filings proportionally by sector size to illustrate relative exposure.
Outlook: The Trump Tariffs of 2025
The return of tariffs under President Trump’s 2025 policy pivot is reshaping U.S. agriculture much as the 2018 trade war did — but under less forgiving financial conditions.
- Export-reliant sectors are likely to face sustained losses, with soybeans, cotton, rice, and pork again the hardest hit.
- Domestic-oriented sectors (sugar, vegetables, shrimp aquaculture) could gain modestly from import substitution.
- Overall balance negative: The largest industries by cash receipts — cattle, corn, soybeans, poultry, and dairy — skew toward net loss.
- Policy uncertainty: Unlike in 2018, Washington’s fiscal room for large-scale subsidy programs is narrower, raising questions over how much relief will be provided.
Bottom line: The 2025 tariff shock risks triggering a deeper farm crisis than 2018, not because the tariffs are larger, but because farmers enter this cycle with higher debt loads, higher financing costs, and thinner margins. If relief is delayed or insufficient, the wave of bankruptcies seen in early 2025 may be only the beginning.