Market Analysis
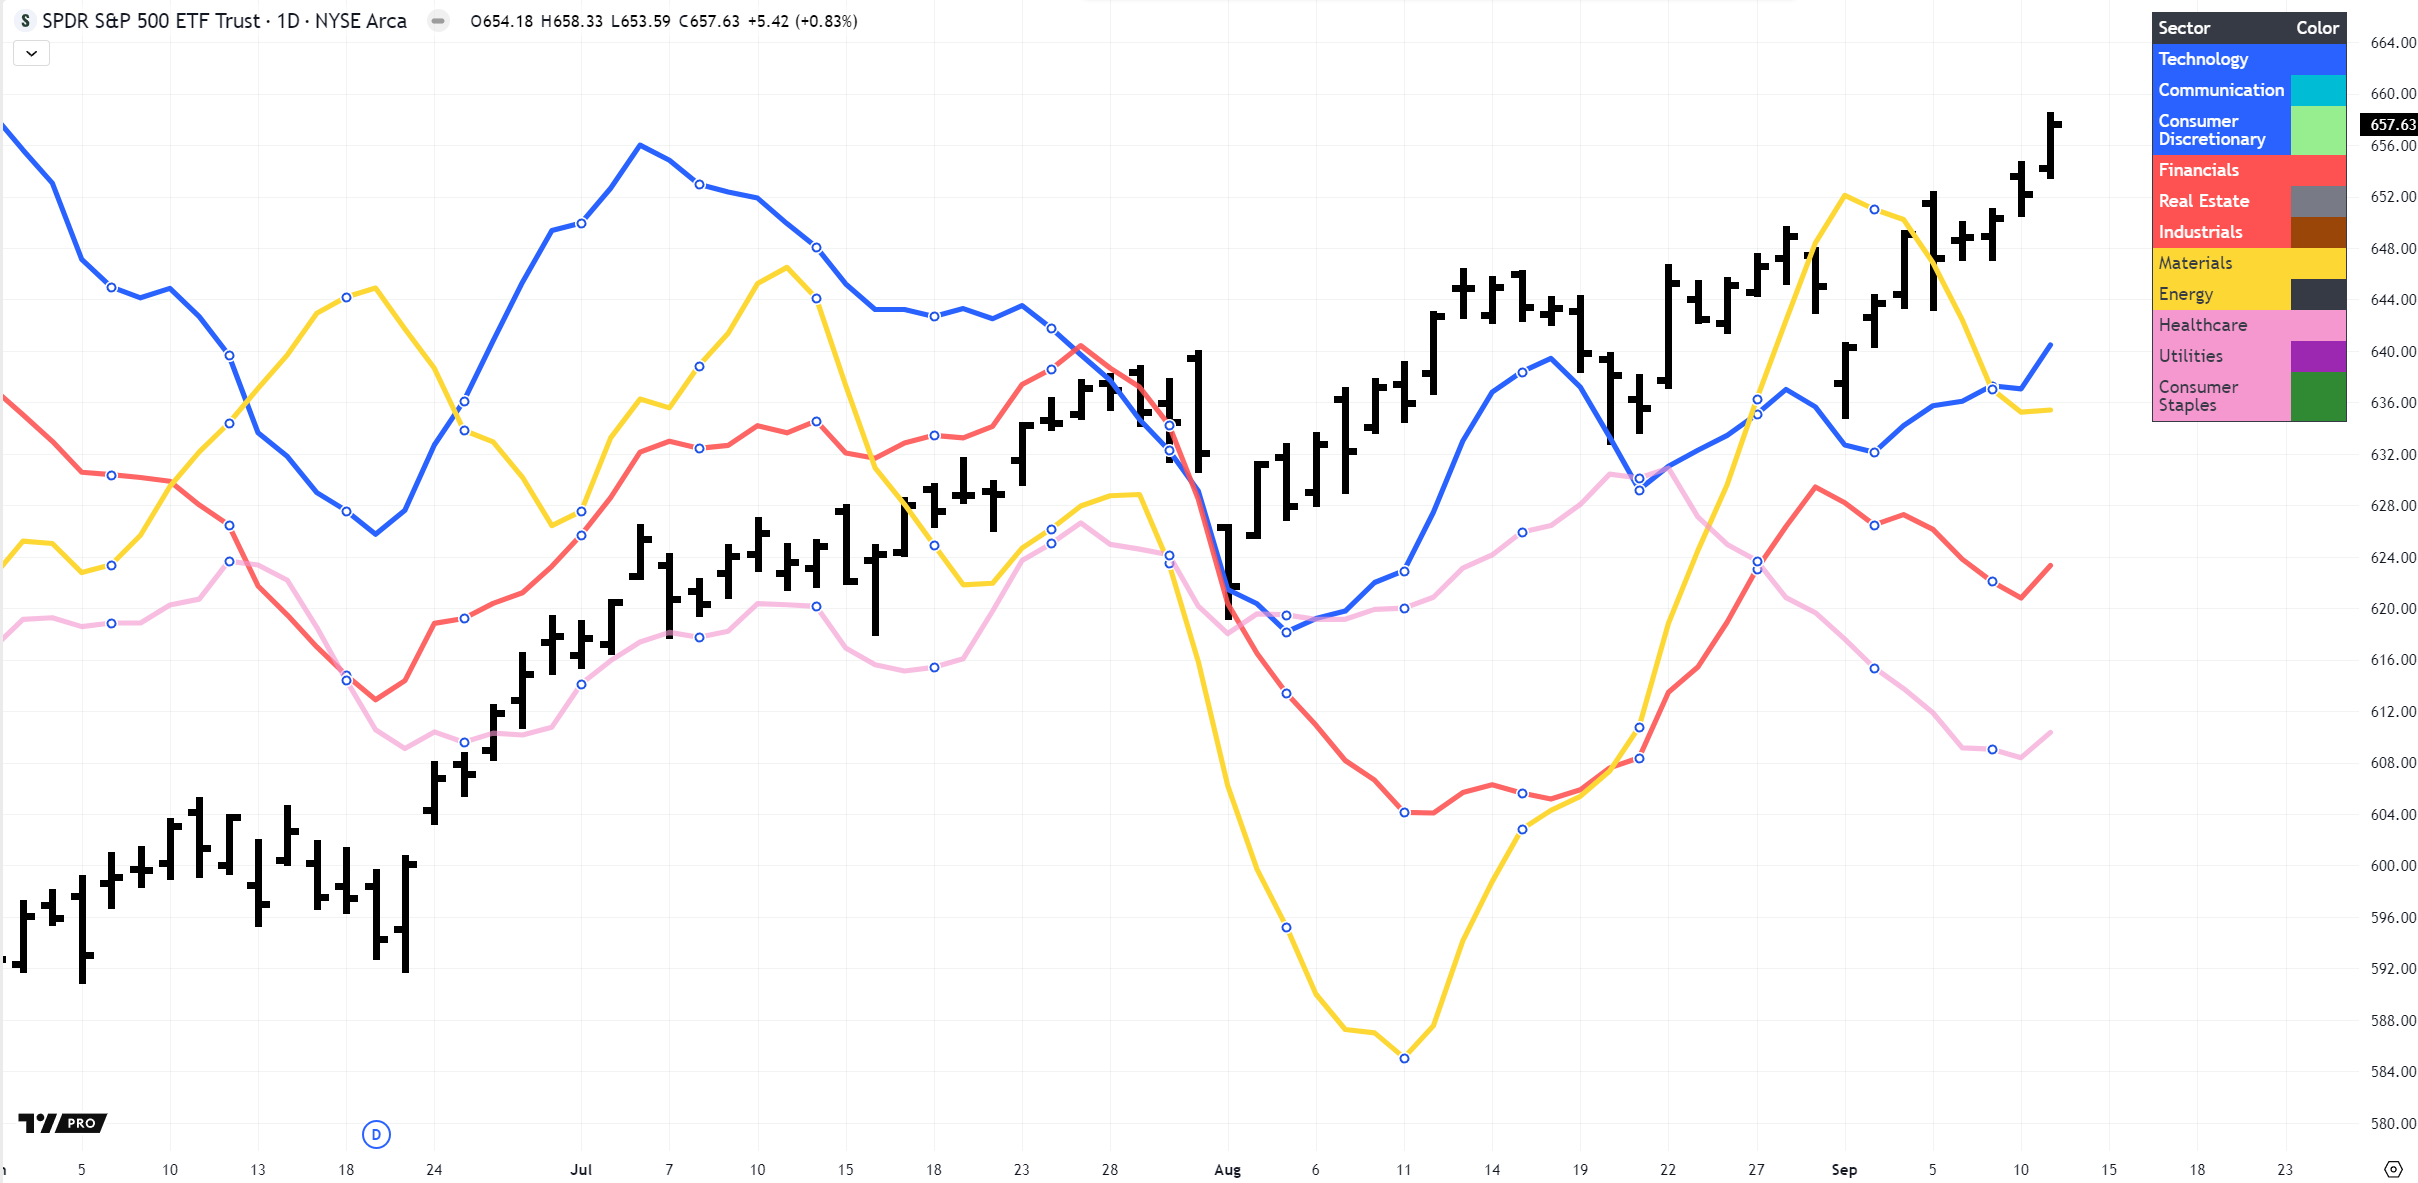
The S&P 500 Indicator registered a Bullish Impulse, propelling the index decisively above the key 6,500 resistance level. The breakout is notable not only for its magnitude but also for the strong participation across sectors and elevated trading volume, underscoring broad market conviction. Interestingly, technology—and especially the MAG-7—were not the primary drivers, suggesting that market leadership is beginning to broaden.
U.S. Indices and Sector Rotation – September 11, 2025
Equities advanced across the board, with the Dow (+1.4%), S&P 500 (+0.8%), and Nasdaq (+0.7%) all closing at record highs. The Russell 2000 outperformed with a 1.8% surge, reflecting renewed interest in cyclical and domestically oriented names. Softer labor data and falling Treasury yields reinforced expectations of upcoming Fed rate cuts, fueling risk appetite and supporting a rotation in leadership.
Beneath the surface, the session marked a clear rotation:
- Cyclicals and small caps outpaced the broader market, breaking the narrow dominance of AI/tech.
- Industrials and financials rallied on easing yield pressure.
- Defensive sectors such as health care and utilities lagged as investors favored higher-beta exposures.
- Energy gained on stronger crude, while mega-cap tech consolidated prior gains with modest advances.
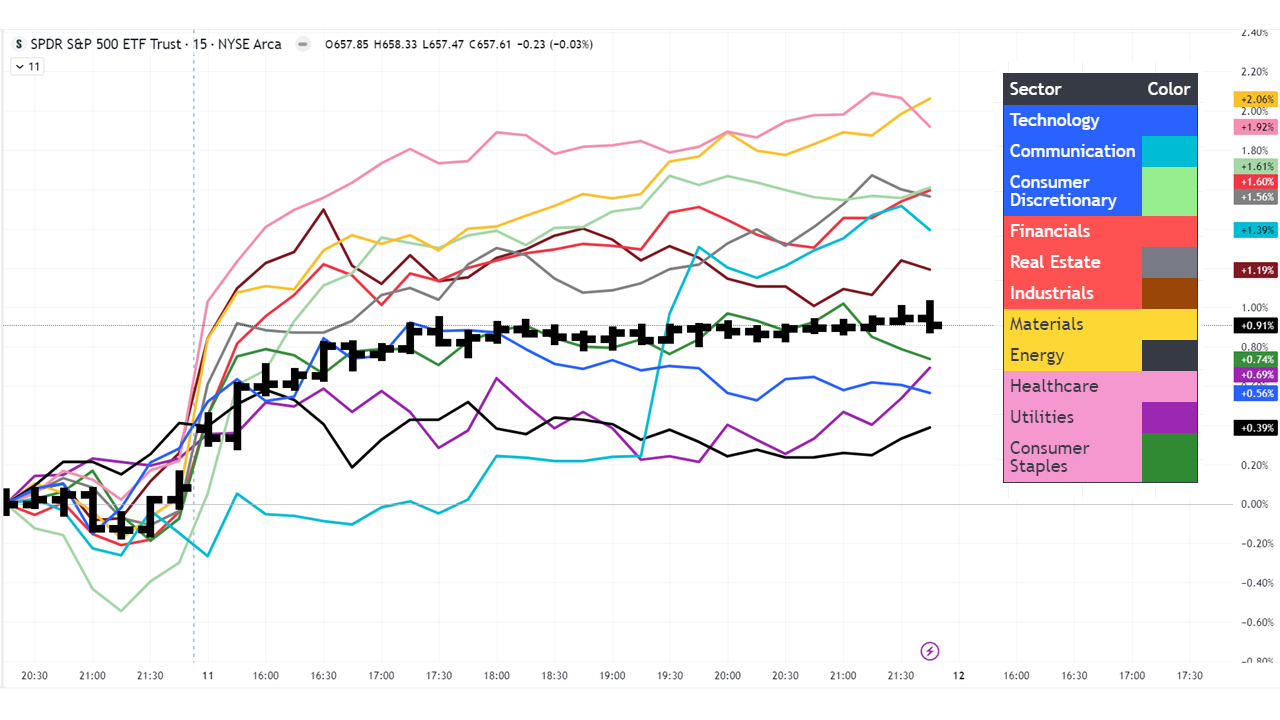
Takeaway: Leadership is broadening beyond the Nasdaq’s tech core—a constructive sign for market breadth and the durability of the rally, especially if the Fed follows through with rate cuts.
Market Outlook
| Level Type | Value | What It Means |
|---|---|---|
| Current Level | 6,587 | Recently broke above major resistance; serves as the new bullish base. |
| Resistance | 6,604 – 6,622 | First resistance zone; clearing it could open the path higher. |
| 6,650+ | Stronger resistance; a breakout here would confirm momentum continuation. | |
| Support | 6,558 – 6,529 | First support band; bulls want to defend this area to maintain upward bias. |
| 6,490 – 6,455 | Deeper support; a break below could trigger profit-taking and more downside. |
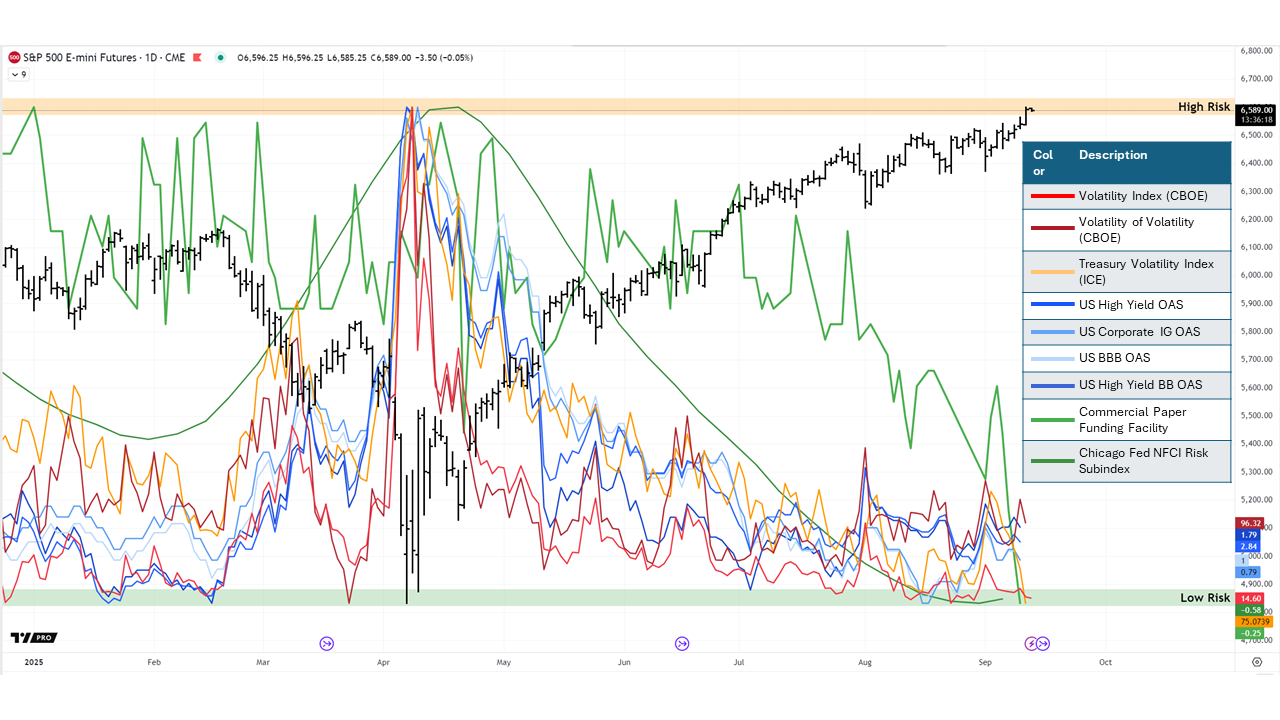
Today’s key focus is whether the weekly close can sustain above current levels or slip back under the 6,529 zone, which would signal a potential false breakout. The probability currently favors continuation rather than reversal, as multiple risk indicators — including VIX, VVIX, MOVE, and credit spreads — have dropped to extreme lows, reflecting broad risk appetite.
CPI Breakdown – August 2025
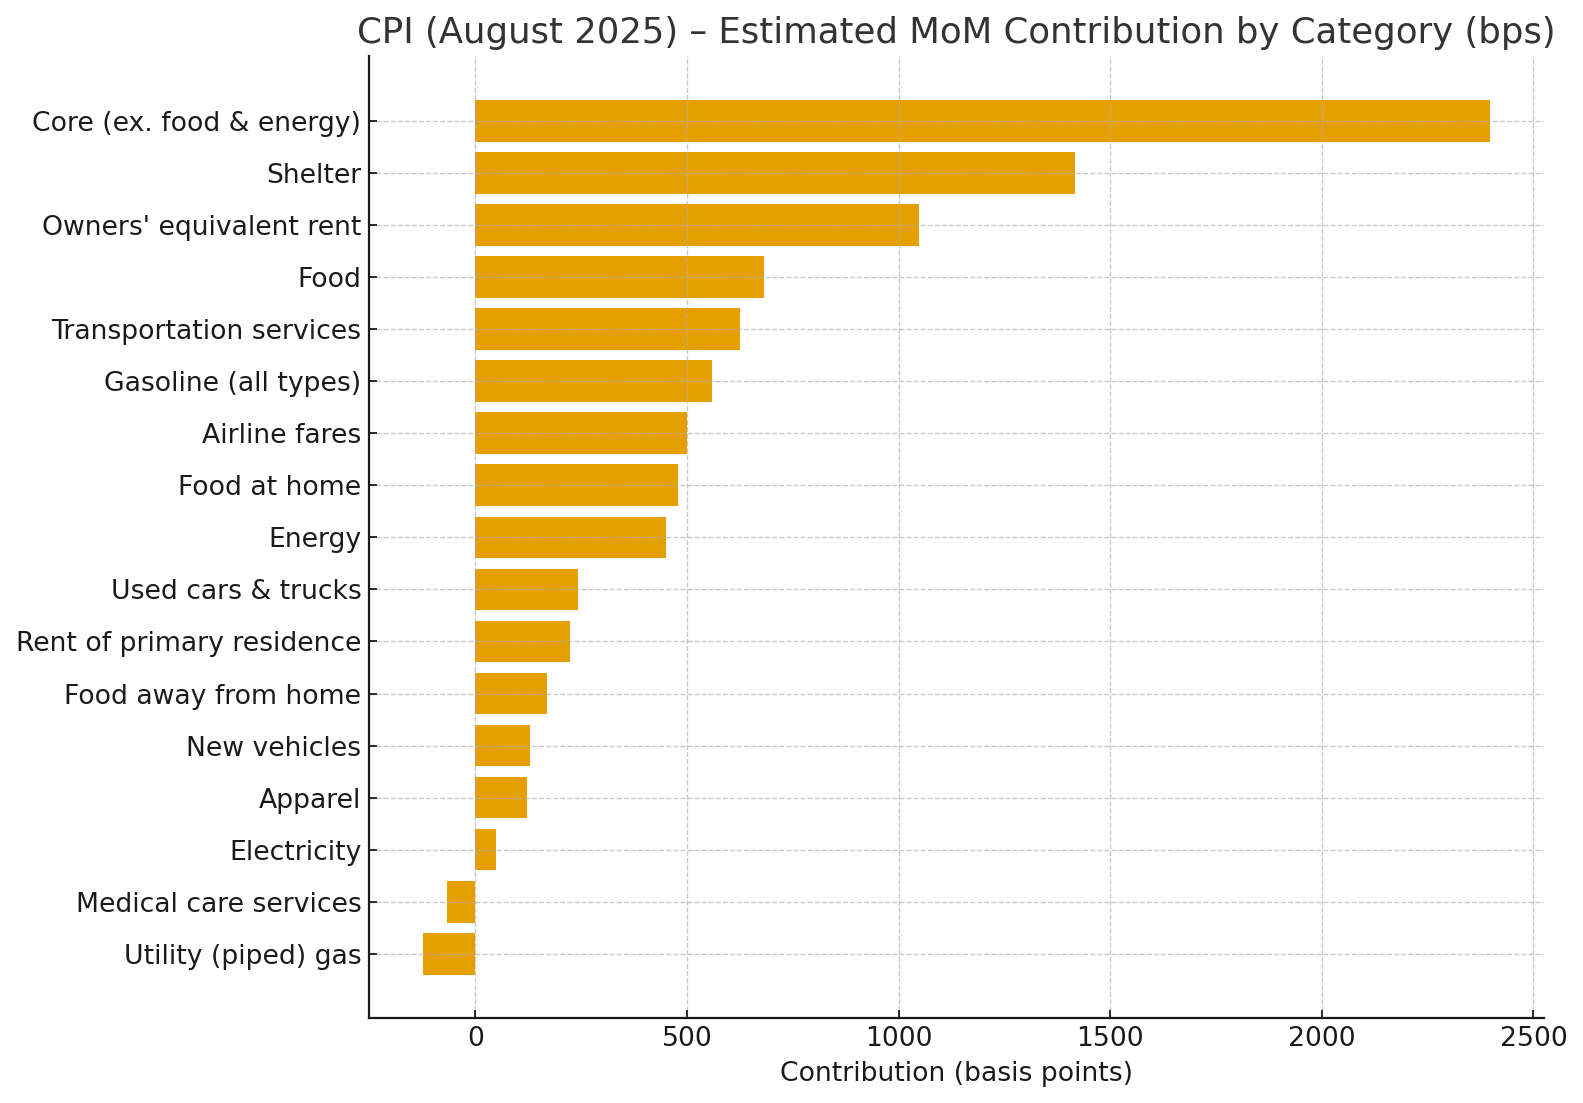
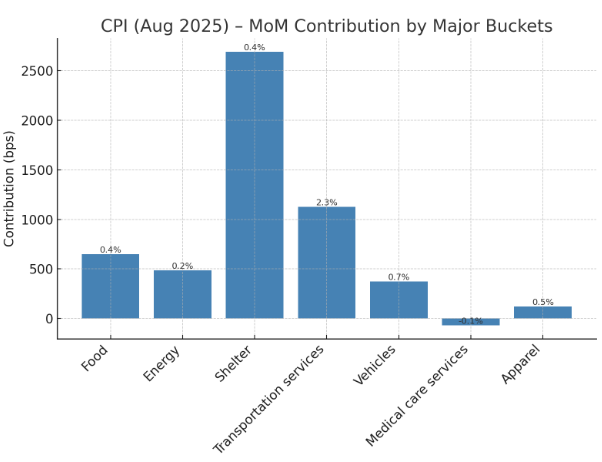
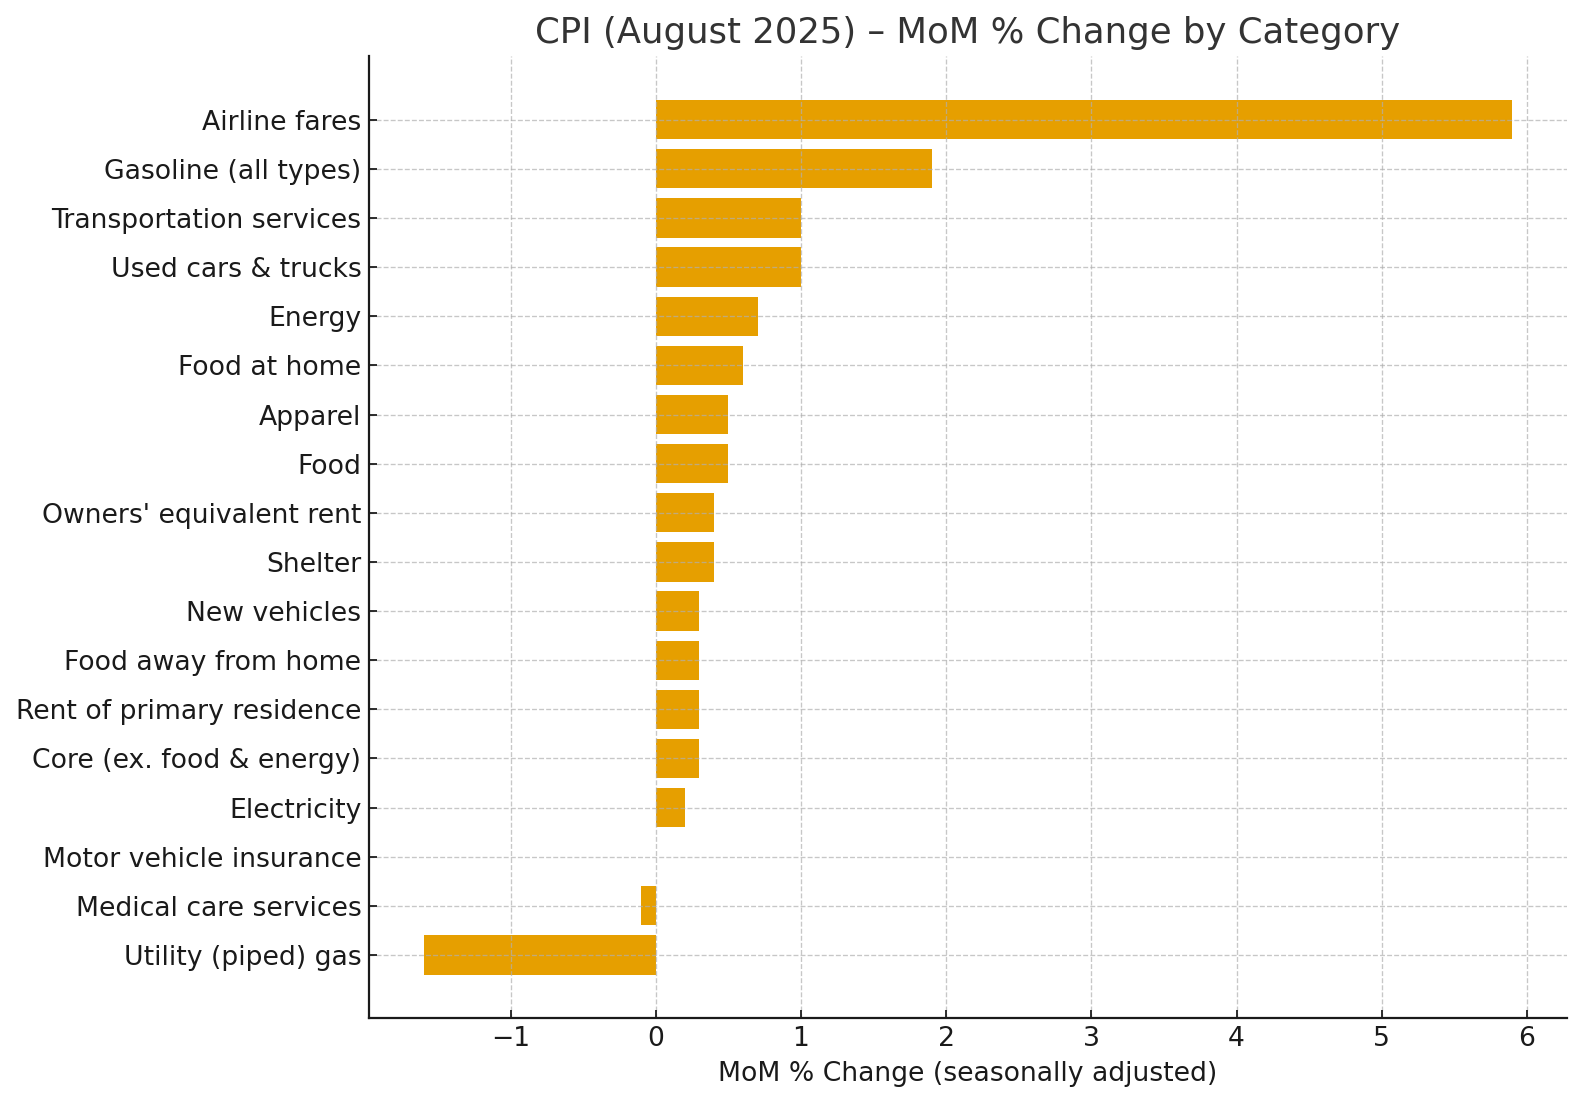
August CPI came in hot at +0.4% m/m (+2.9% y/y), with the bulk of the pressure once again coming from shelter and services. Shelter alone contributed roughly 14 bps to the headline, driven by steady gains in rents and owners’ equivalent rent. Transportation services were another standout, adding about 6 bps as airline fares spiked nearly 6%. Food prices also moved higher, particularly groceries (+0.6%), and energy edged up thanks to a rebound in gasoline (+1.9%), partially offset by falling natural gas (−1.6%). Vehicle prices firmed modestly, with used cars posting a +1% gain, while apparel added a small upward push. The one area of relief came from medical care services (−0.1%), which shaved off a fraction of a basis point.
Quick take:
What rose → Shelter, transportation services (especially airfares), gasoline, food at home, used cars.
What fell → Utility gas, medical services.
The picture is clear: core services inflation remains sticky, while goods are stabilizing with isolated rebounds. Investors will interpret this as confirmation that disinflation is progressing only slowly, keeping the Fed cautious despite easing energy and medical costs.