Market Analysis
The S&P 500 and Nasdaq hit record highs after softer PPI data reinforced Fed rate-cut hopes, sending Treasury yields lower and boosting growth stocks.
- Tech/AI: Led the rally. Oracle surged on strong cloud/AI guidance, pulling semis and data-center names higher.
- Consumer Discretionary: Lagged, reflecting pressure on spending and rotation out of cyclicals.
- Dow components (Apple, Amazon): Weighed on index breadth despite the broader rally.
Oracle Earnings
Oracle’s Q1 FY26 results showed revenue up 11% YoY to $14.9B, with cloud infrastructure up 54%. Remaining Performance Obligations exploded +359% YoY to $455B, signaling robust future demand. The upbeat AI/cloud outlook turned Oracle into the session’s main catalyst, lifting the broader tech complex.
SP500 Indicator
The Indicator dropped into caution territory through yesterday’s session, signaling continued distribution near the 6500 Sell-Zone. Despite inflation relief and Oracle’s guidance, sector divergence highlights macro headwinds for consumers. Yesterday’s highs were quickly sold off, leaving S&P price action unconvincing on the bull side.
What is behind yesterday’s PPI numbers?
Yesterday’s Producer Price Index (PPI) showed a slight decline of −0.1% m/m, driven by a divergence between goods and services. Goods ex food & energy rose +0.3%, providing the main positive contribution, while food goods added modestly and transport/warehousing services were slightly higher. Offsetting these gains, energy goods fell as gasoline and natural gas prices eased, and the biggest drag came from trade services, which dropped sharply and pulled the overall index lower.
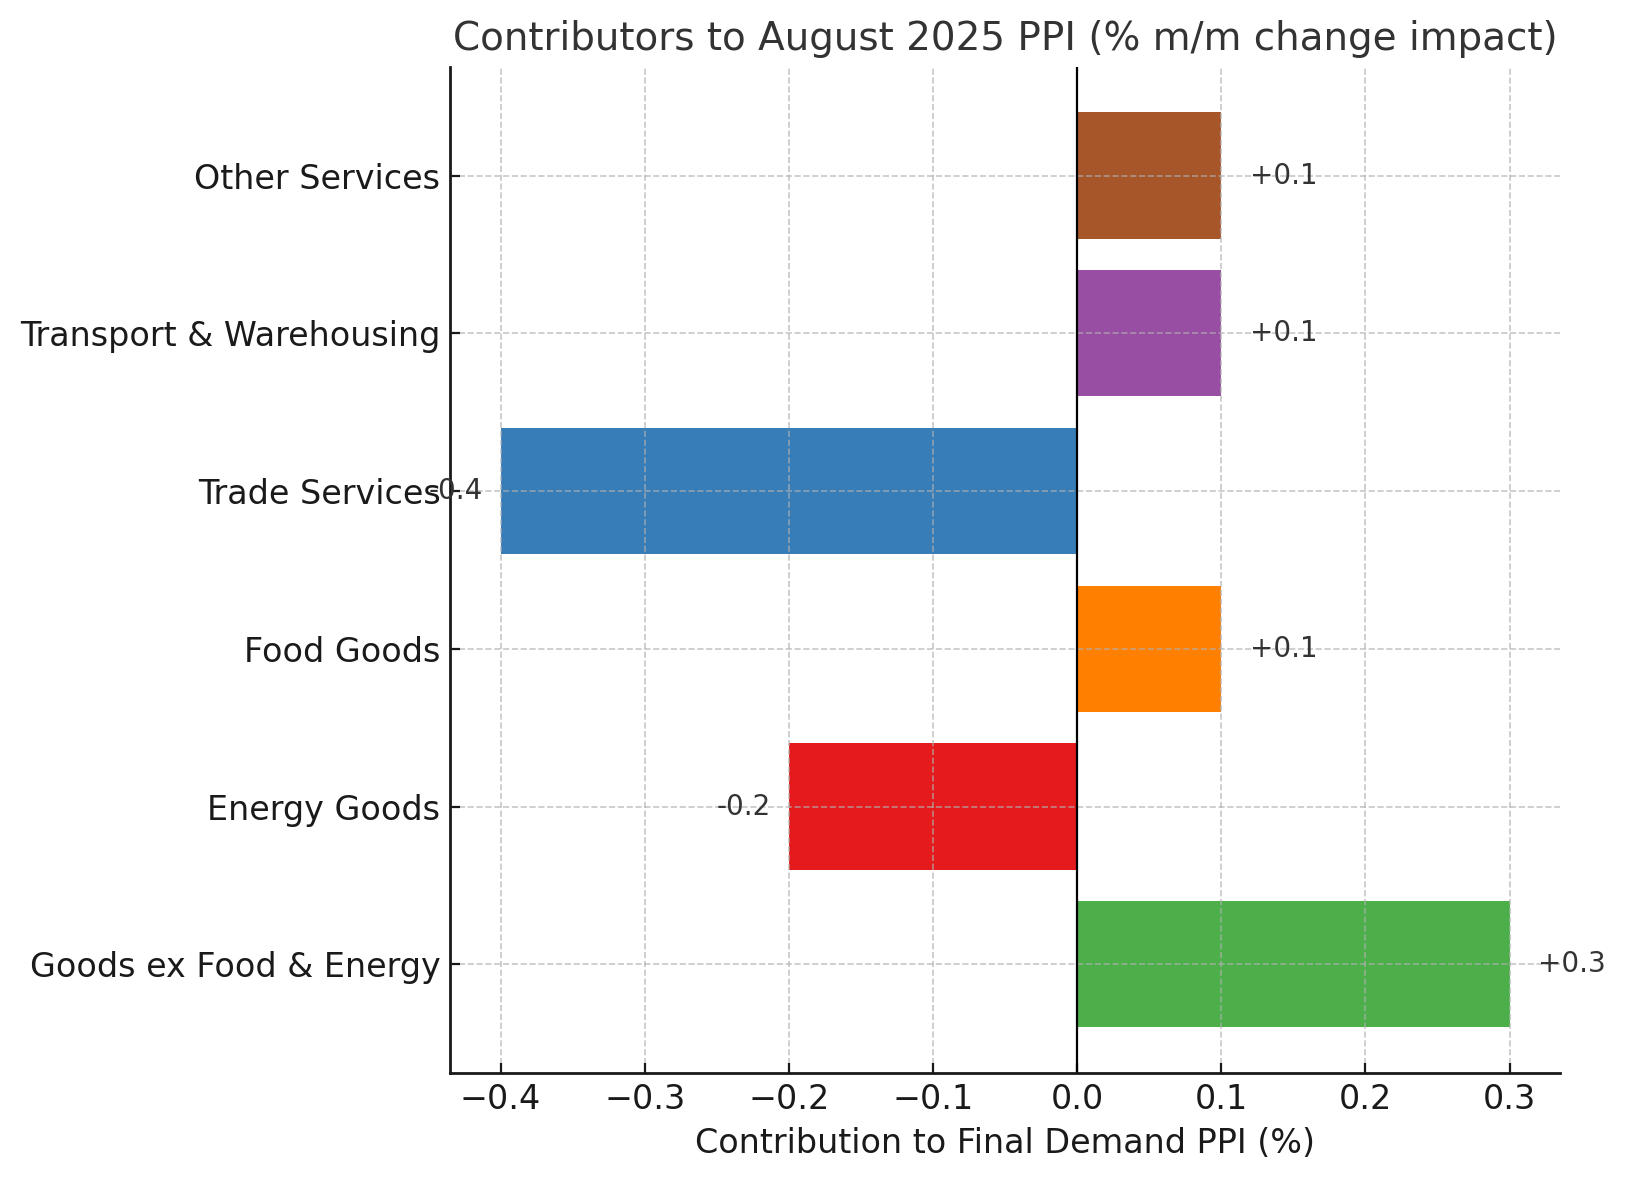
The trade services component measures wholesale and retail margins rather than sticker prices. In August, margins fell across categories such as fuel, lubricants, and food retailing. This suggests retailers and wholesalers absorbed more costs or offered discounts to sustain demand. The result is disinflationary at the PPI level, but it also highlights pressure on corporate profitability in consumer-facing sectors.
Goldman Sachs’ Latest Research on Core Inflation (past 5 months)
| Report | Date | Key Findings | Implications |
|---|---|---|---|
| June 2025 Consumer Dashboard | 2 months ago | • Core PCE rose 0.18% m/m in May, up 2.68% YoY. • Headline PCE +0.14% m/m, +2.34% YoY. |
Inflation above the Fed’s 2% target but moderating. |
| May 2025 Consumer Dashboard | 3 months ago | • Core PCE +0.12% m/m in April, slipping to 2.52% YoY. | Confirms moderation trend, though rebounds remain a risk. |
| ISG in Brief: Mid-Year Update (June 2025) | 2 months ago | • GS projects Core PCE 3.5% by end-2025. • Without tariffs, closer to 2.1%. |
Tariffs add a one-off shock but not broad momentum. |
| Tariff-Induced Recession Risk | 5 months ago | • Tariffs push U.S. goods prices higher but weigh on growth. | Tariffs complicate inflation readings and policy response. |
CPI and the S&P 500: What History Tells Us and What to Expect Today
CPI surprises have a proven record of moving markets. Historically, even a 0.1 pp deviation in Core CPI from expectations has triggered ±0.5%–1.5% S&P moves, with larger surprises producing swings above ±2%. Hot prints weigh on Growth/Tech, while softer data sparks broad rallies.
Today’s Expectations (Sep 11, 2025)
- Headline CPI: +0.3% m/m, 2.9% YoY
- Core CPI: +0.3% m/m, 3.1% YoY
Tariff pass-through poses upside risk, while cooler PPI suggests easing further ahead.
Market Scenarios
| Scenario | CPI Outcome | Likely S&P 500 Reaction |
|---|---|---|
| Bullish | Softer (<0.3% m/m; YoY below forecast) | Rally +0.5% to +1.5%, yields fall, USD weakens |
| Bearish | Hotter (≥0.4% m/m; YoY >3.1%) | Pullback −1% to −2%, yields rise, USD strengthens |
Outlook
Today’s CPI release is the decisive trigger. A softer print could unlock hopes for faster Fed easing and lift equities, while sticky inflation would reinforce a “higher for longer” stance and pressure the S&P 500.