Recession Watch: S&P rallies, despite Economic Indicators Flashing Red
Despite a broad set of economic indicators flashing red—from labor market weakness and yield curve distortions to manufacturing contraction and rising consumer delinquencies—the S&P 500 continues to grind higher. This week’s analysis reviews labor data revisions, credit stress, industrial production, housing affordability, and construction costs, providing a comprehensive recession watch update. While markets remain buoyant, the weight of evidence suggests the U.S. economy is moving closer to a downturn.
-
BLS Benchmark Revisions
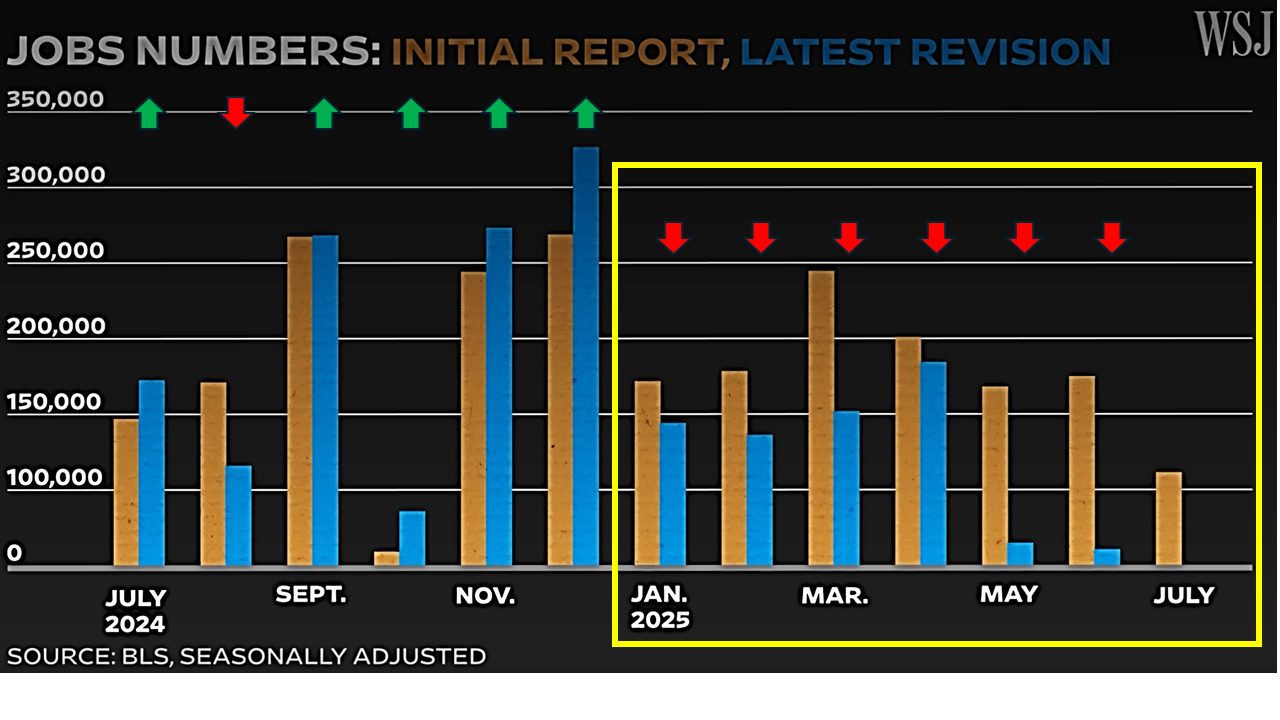
U.S. job growth was revised down by 911,000 through March 2025. Such downward adjustments typically occur at turning points, underscoring weaker labor momentum than initially reported.
Source: WSJ -
Unemployment & Sahm Rule
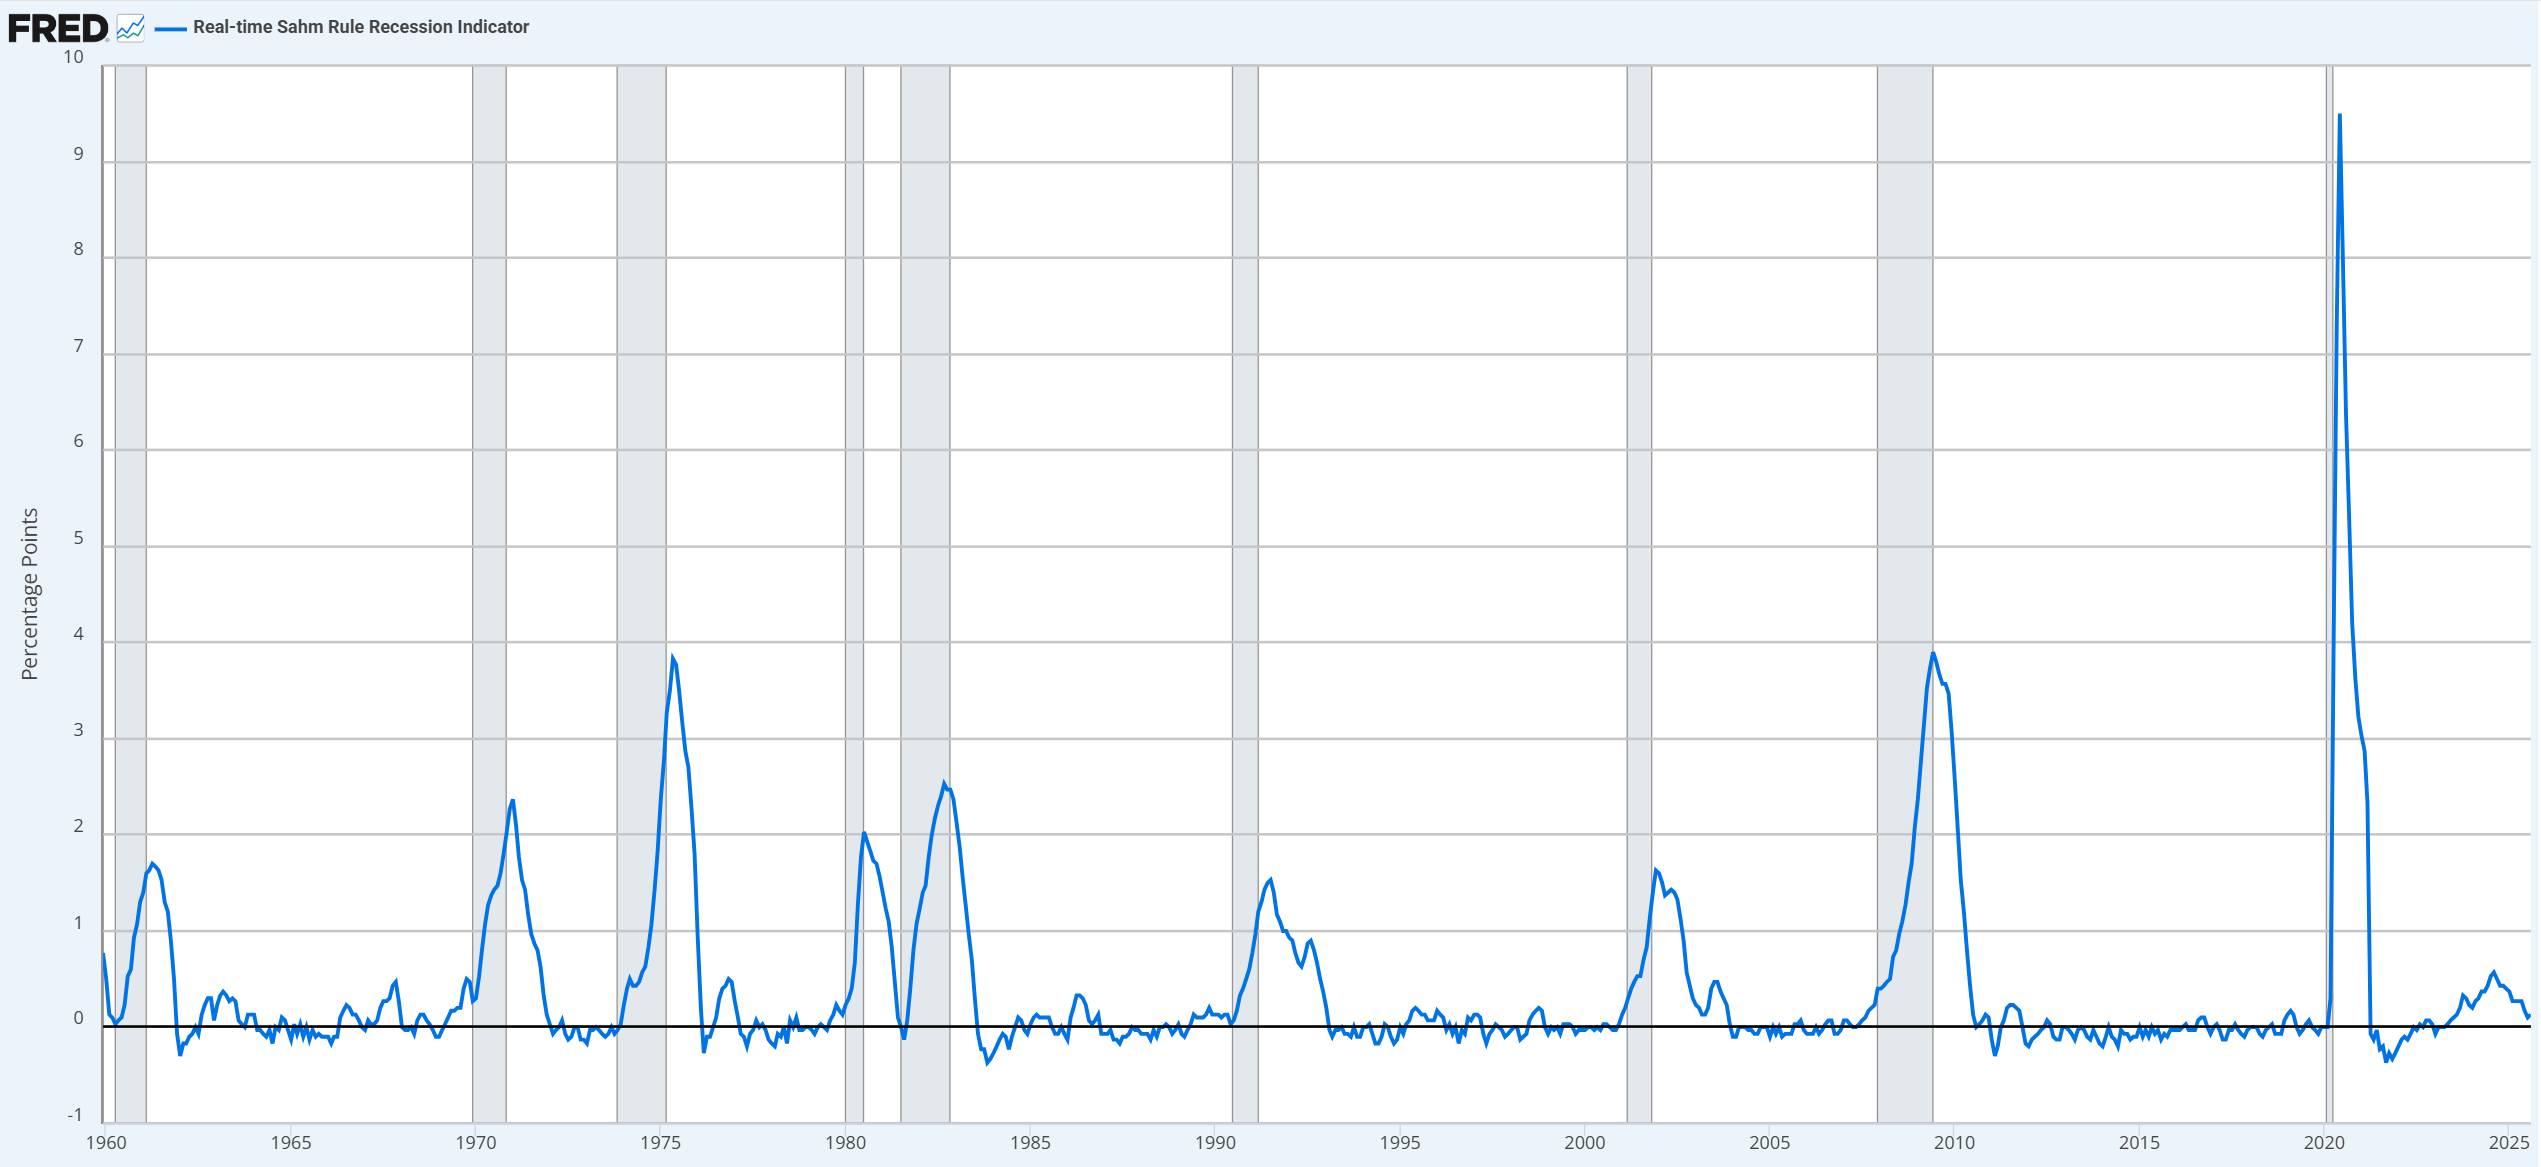
The unemployment rate has risen from cycle lows, bringing the Sahm Rule trigger into view (≥0.5 pp above its 12-month low). Historically, this has coincided with recession starts.
Source: FRED Sahm Rule -
JOLTS Job Openings & Labor Tightness
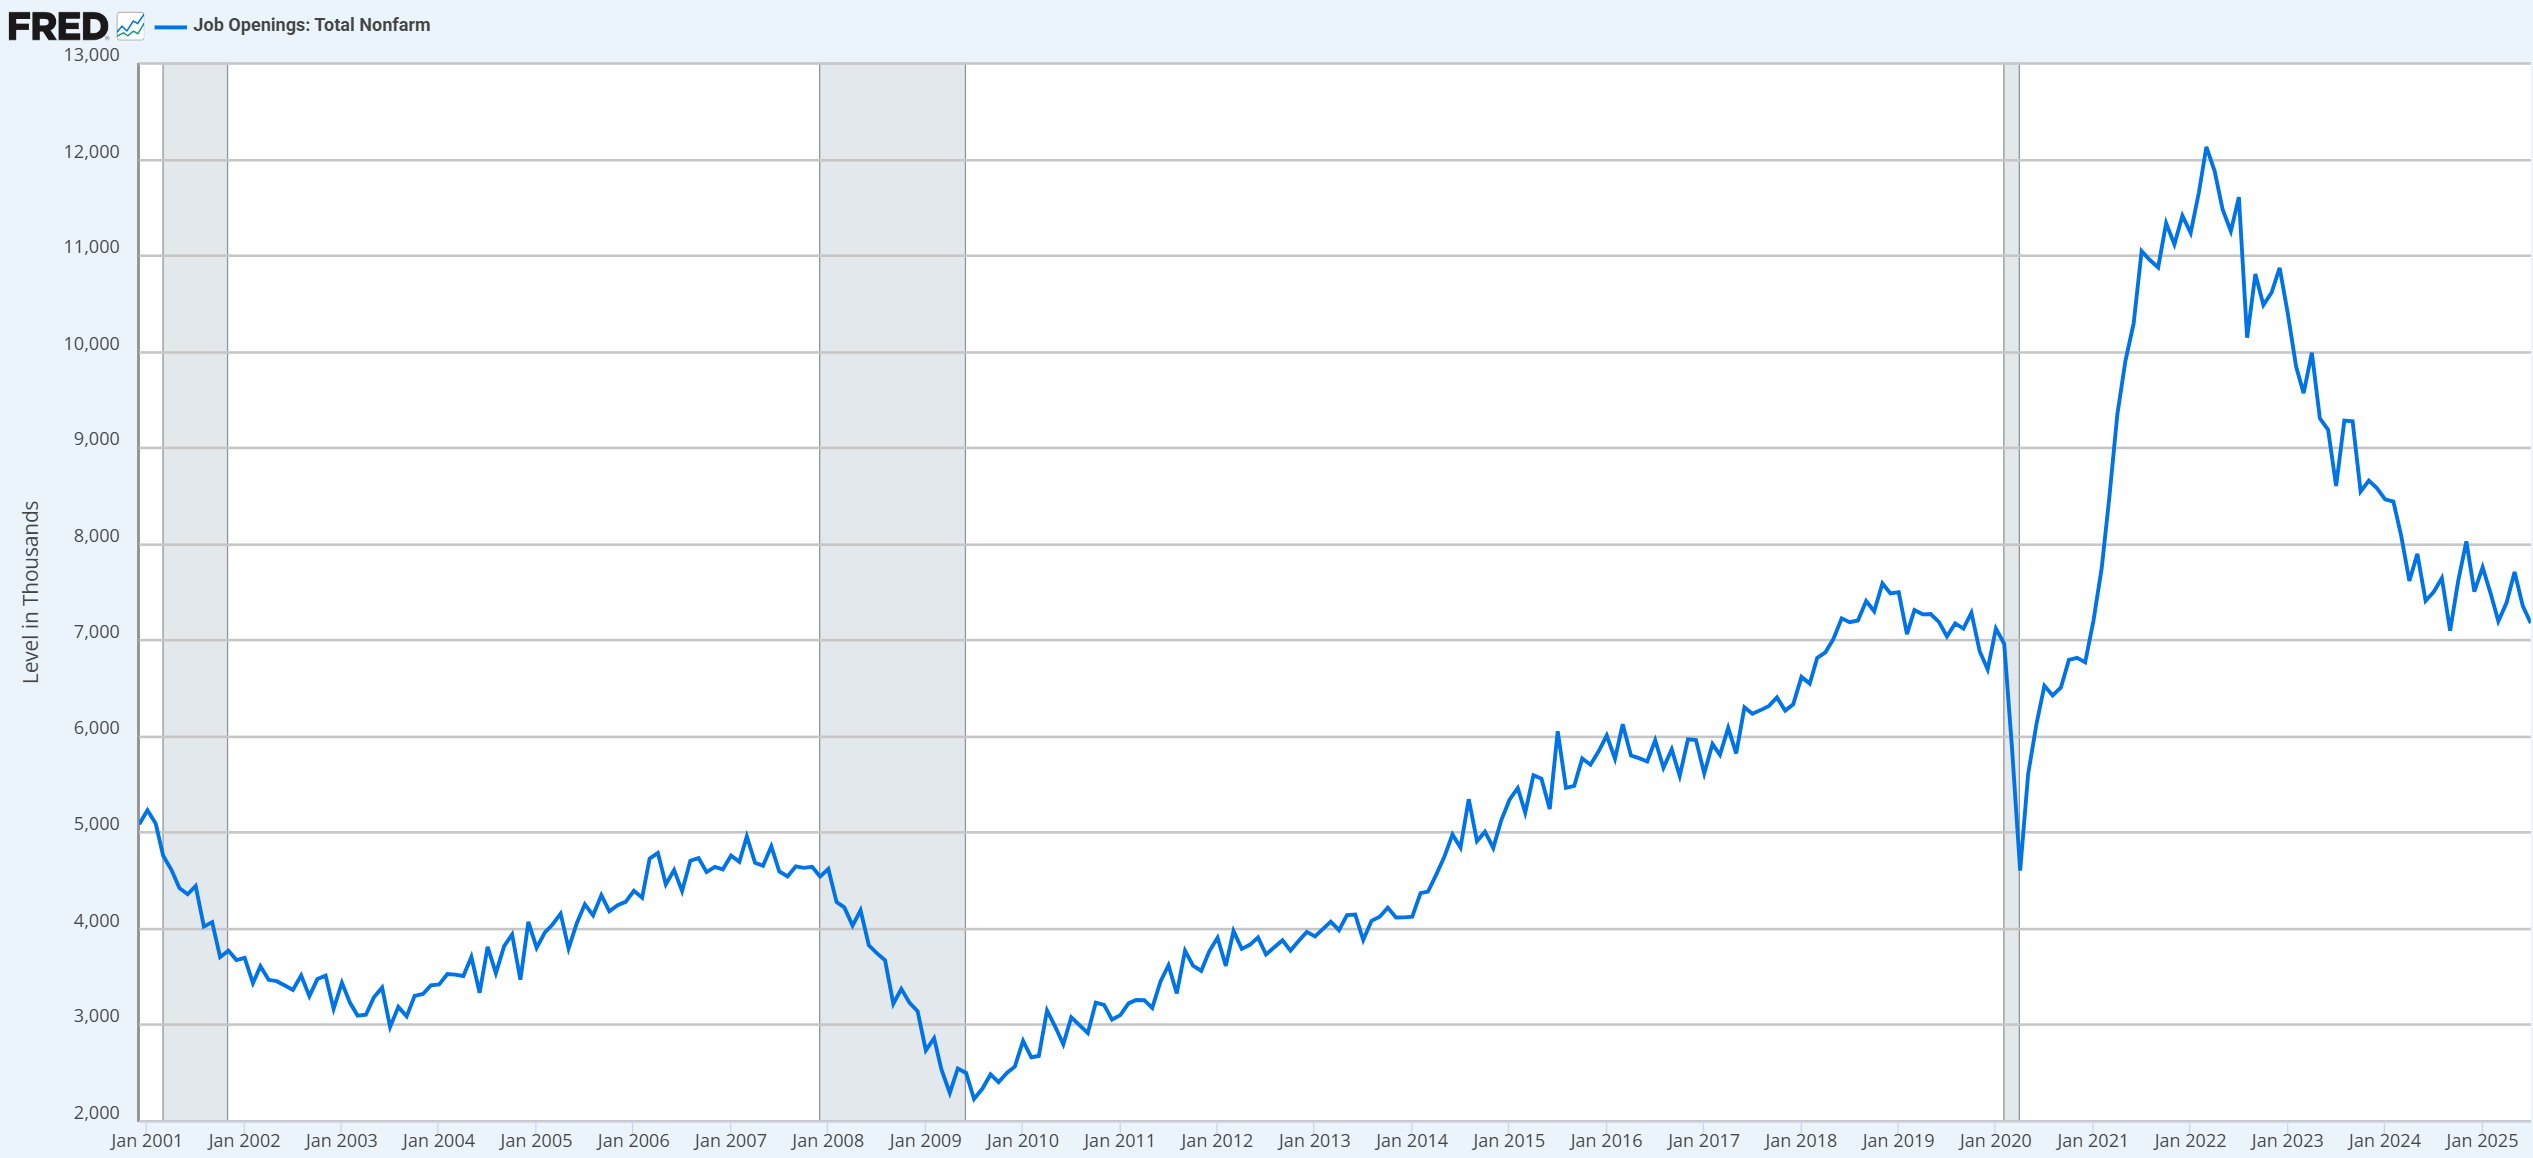
Job openings continue to decline, and for the first time since the pandemic, the number of unemployed exceeds available openings. This points to cooling labor demand.
Sources: FRED JOLTS, Reuters -
Continuing Unemployment Claims
Claims have been drifting higher through late August, signaling increasing difficulty for workers to re-enter employment.
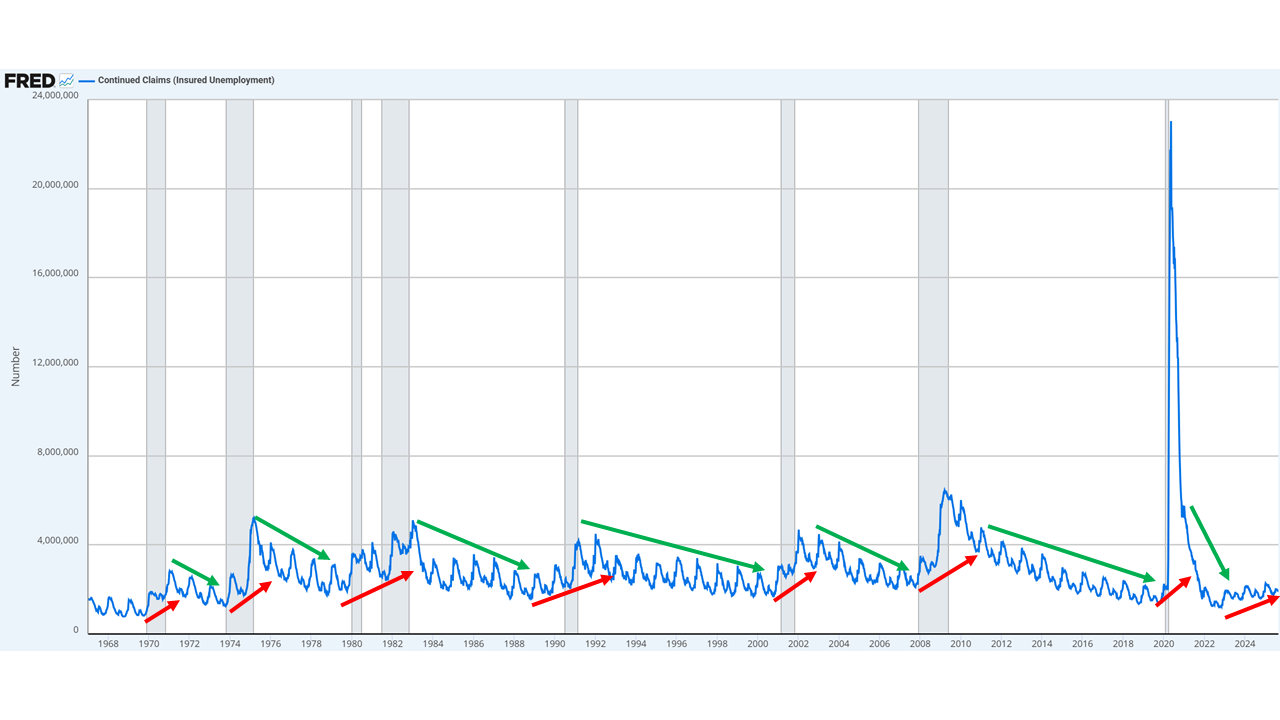
Since August, the number of unemployed has risen above the job openings figure.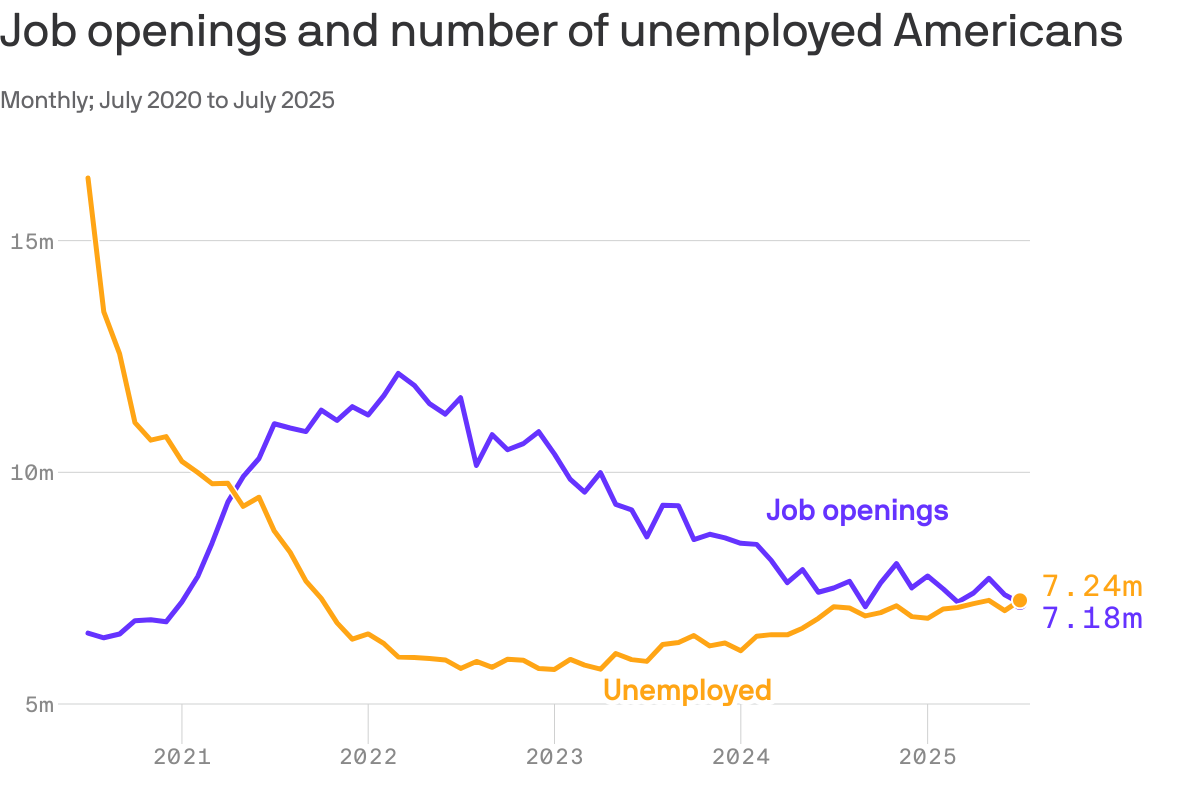
Source: FRED Continued Claims
Cross-check: Services employment is also contracting, and unemployed now outnumber job openings—clear signs of labor market deterioration.
-
Conference Board LEI
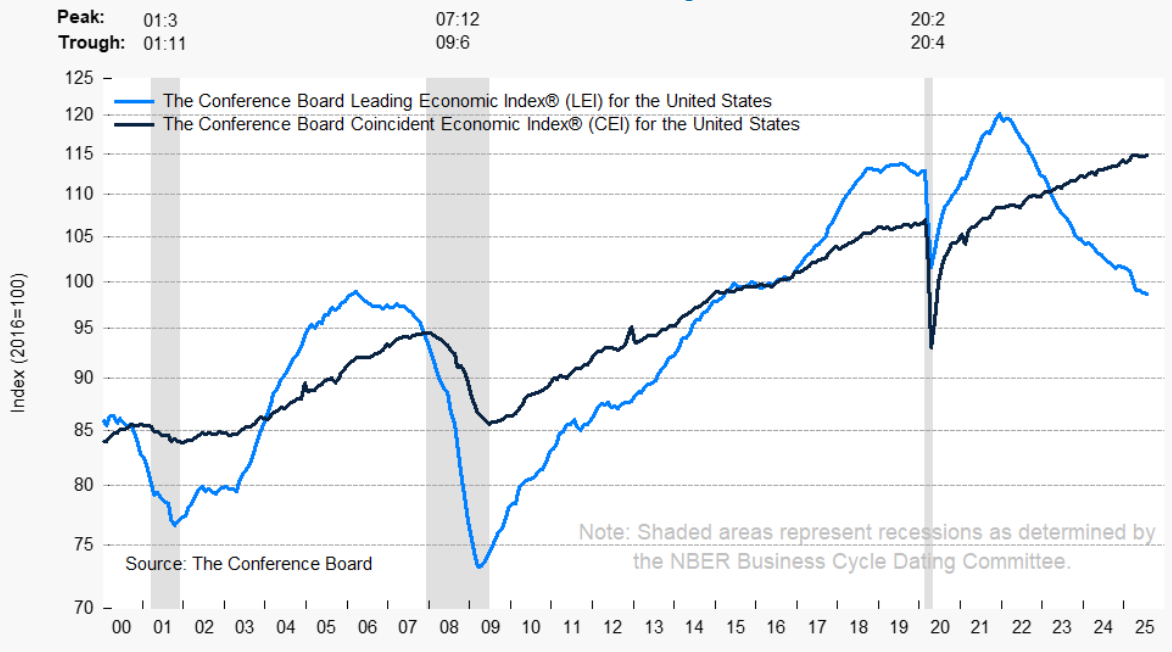
The LEI fell 0.1% in July (to 98.7), down 2.7% over six months. Persistent declines have historically preceded downturns.
Source: Conference Board -
Yield Curve (10y–3m)
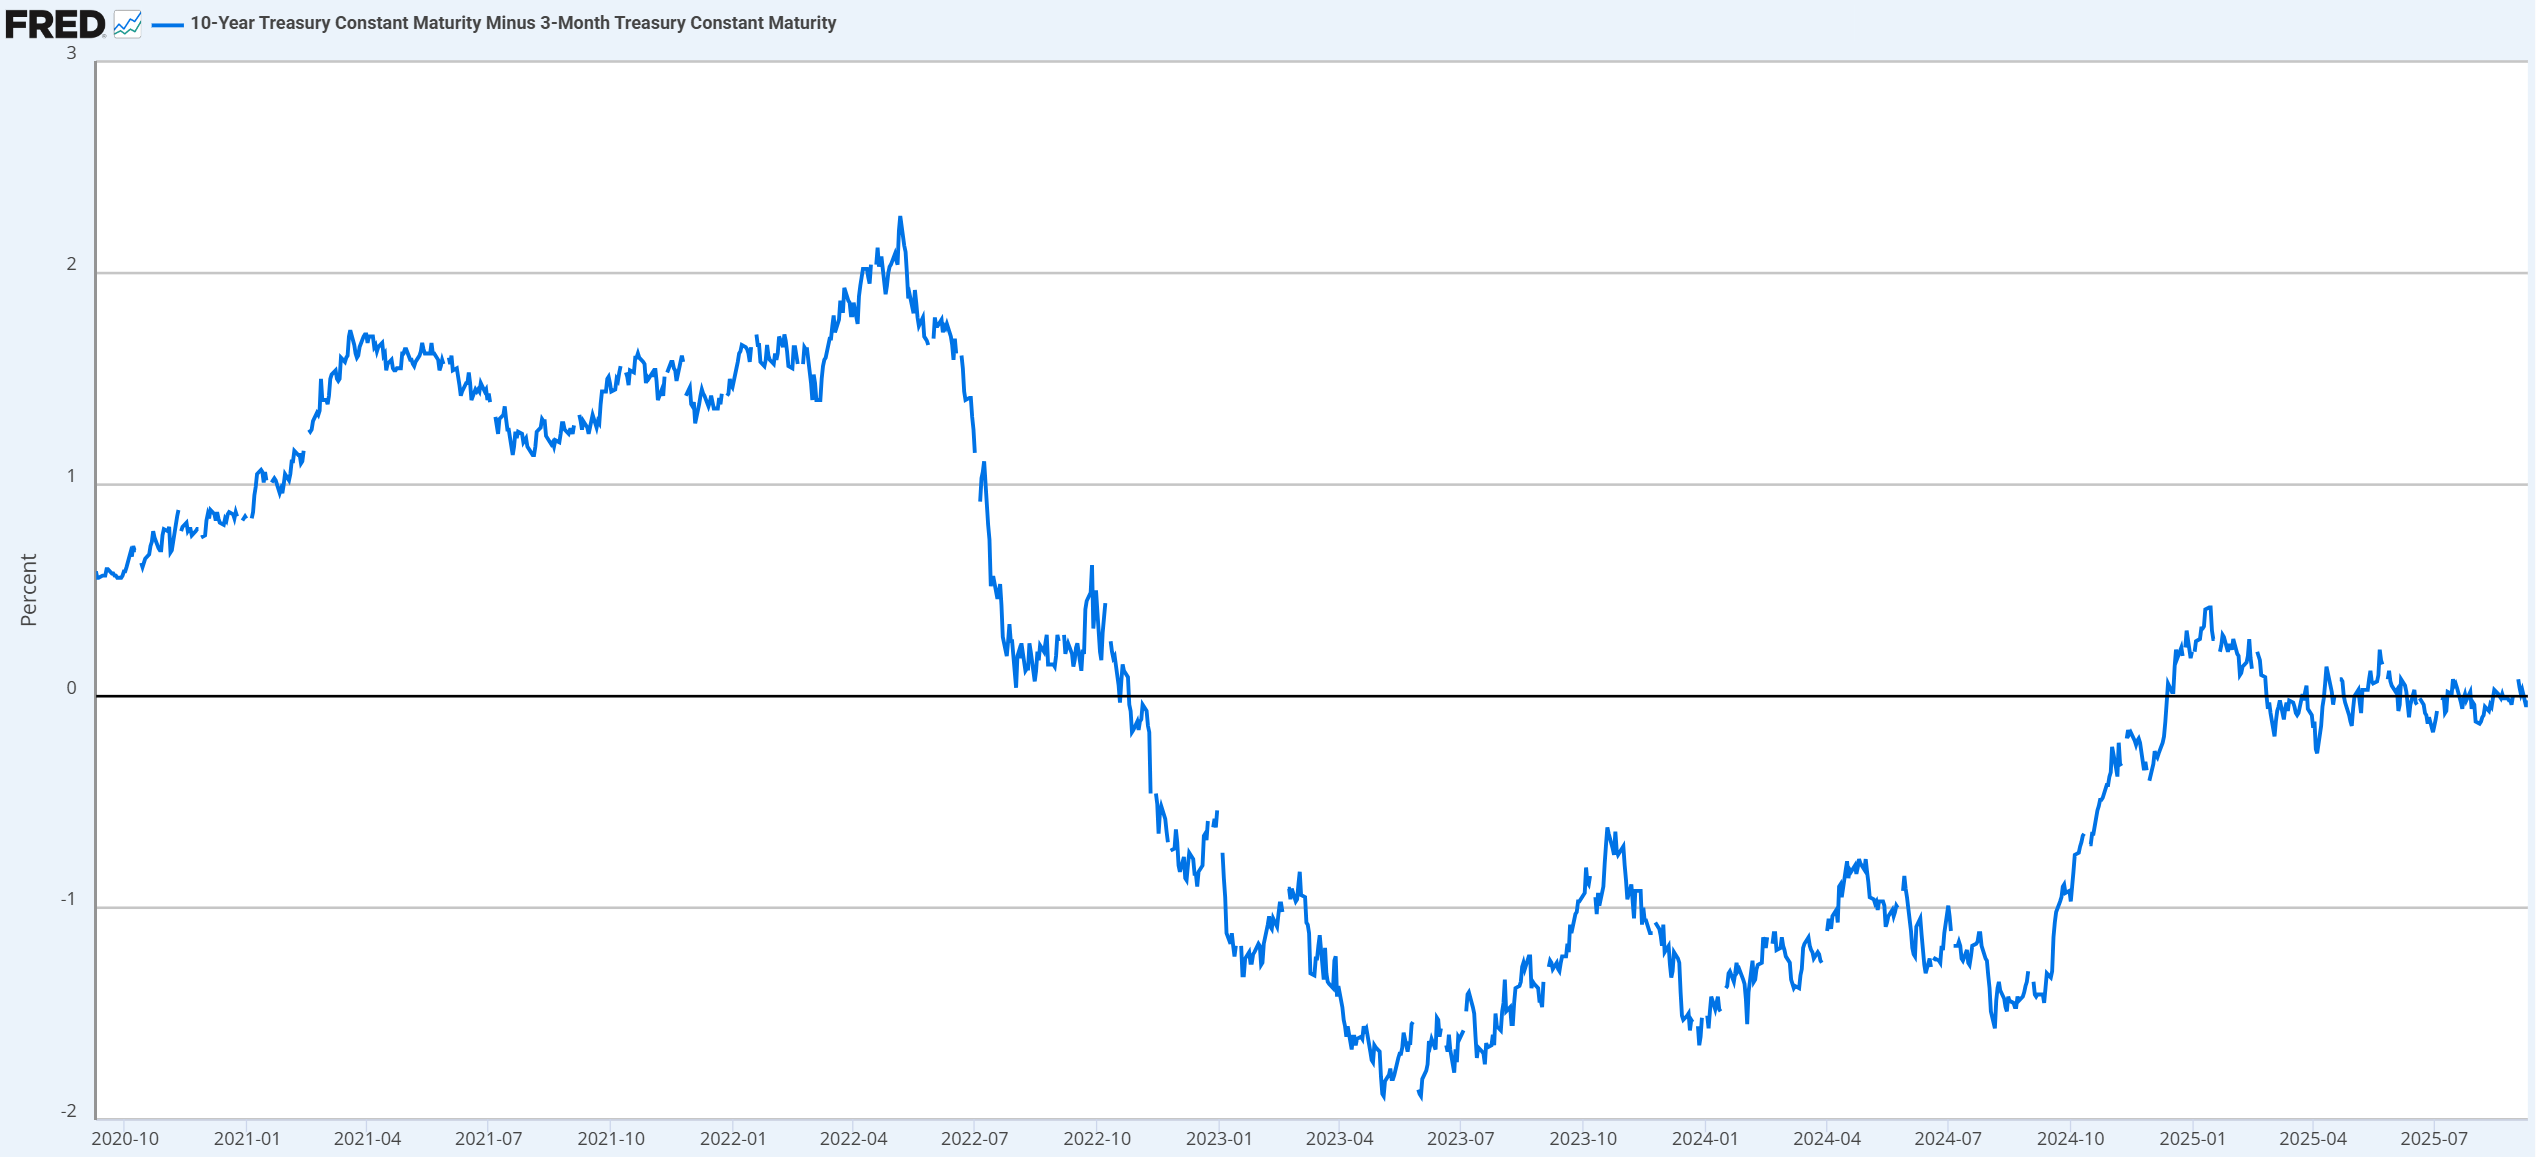
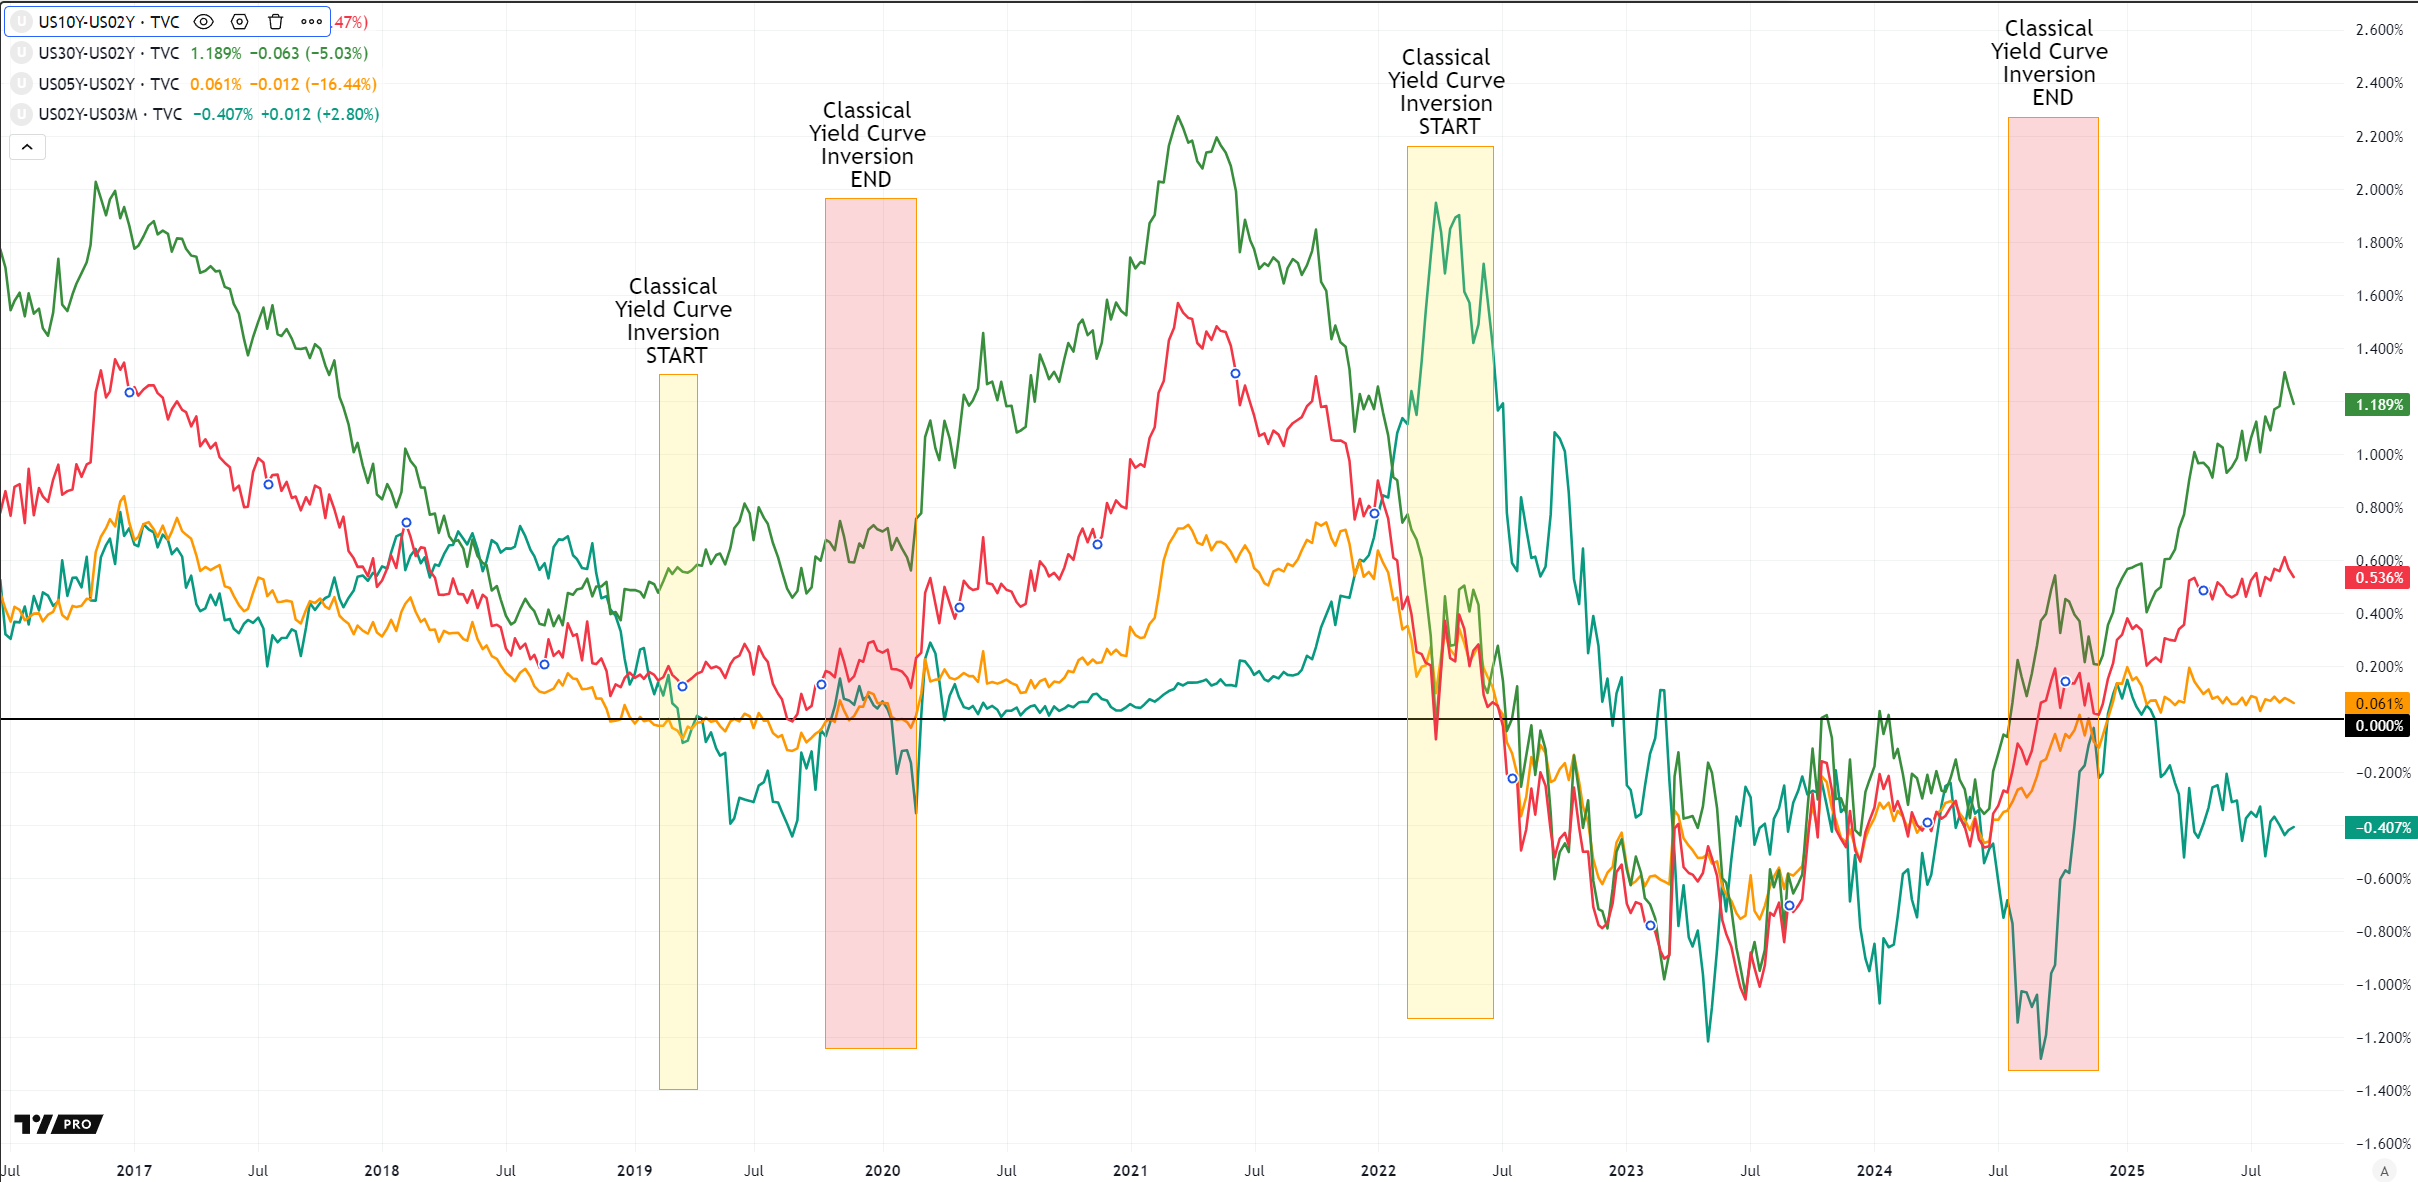
The curve remains deeply inverted, a historically reliable recession signal. More recently, steepening has emerged: short-end yields are drifting lower as markets price in Fed cuts, while long yields climb on inflation risks, Treasury supply, and term premium repricing. Such “bear steepeners” often develop late in the cycle, ahead of recessions.
Source: SP500 Navigator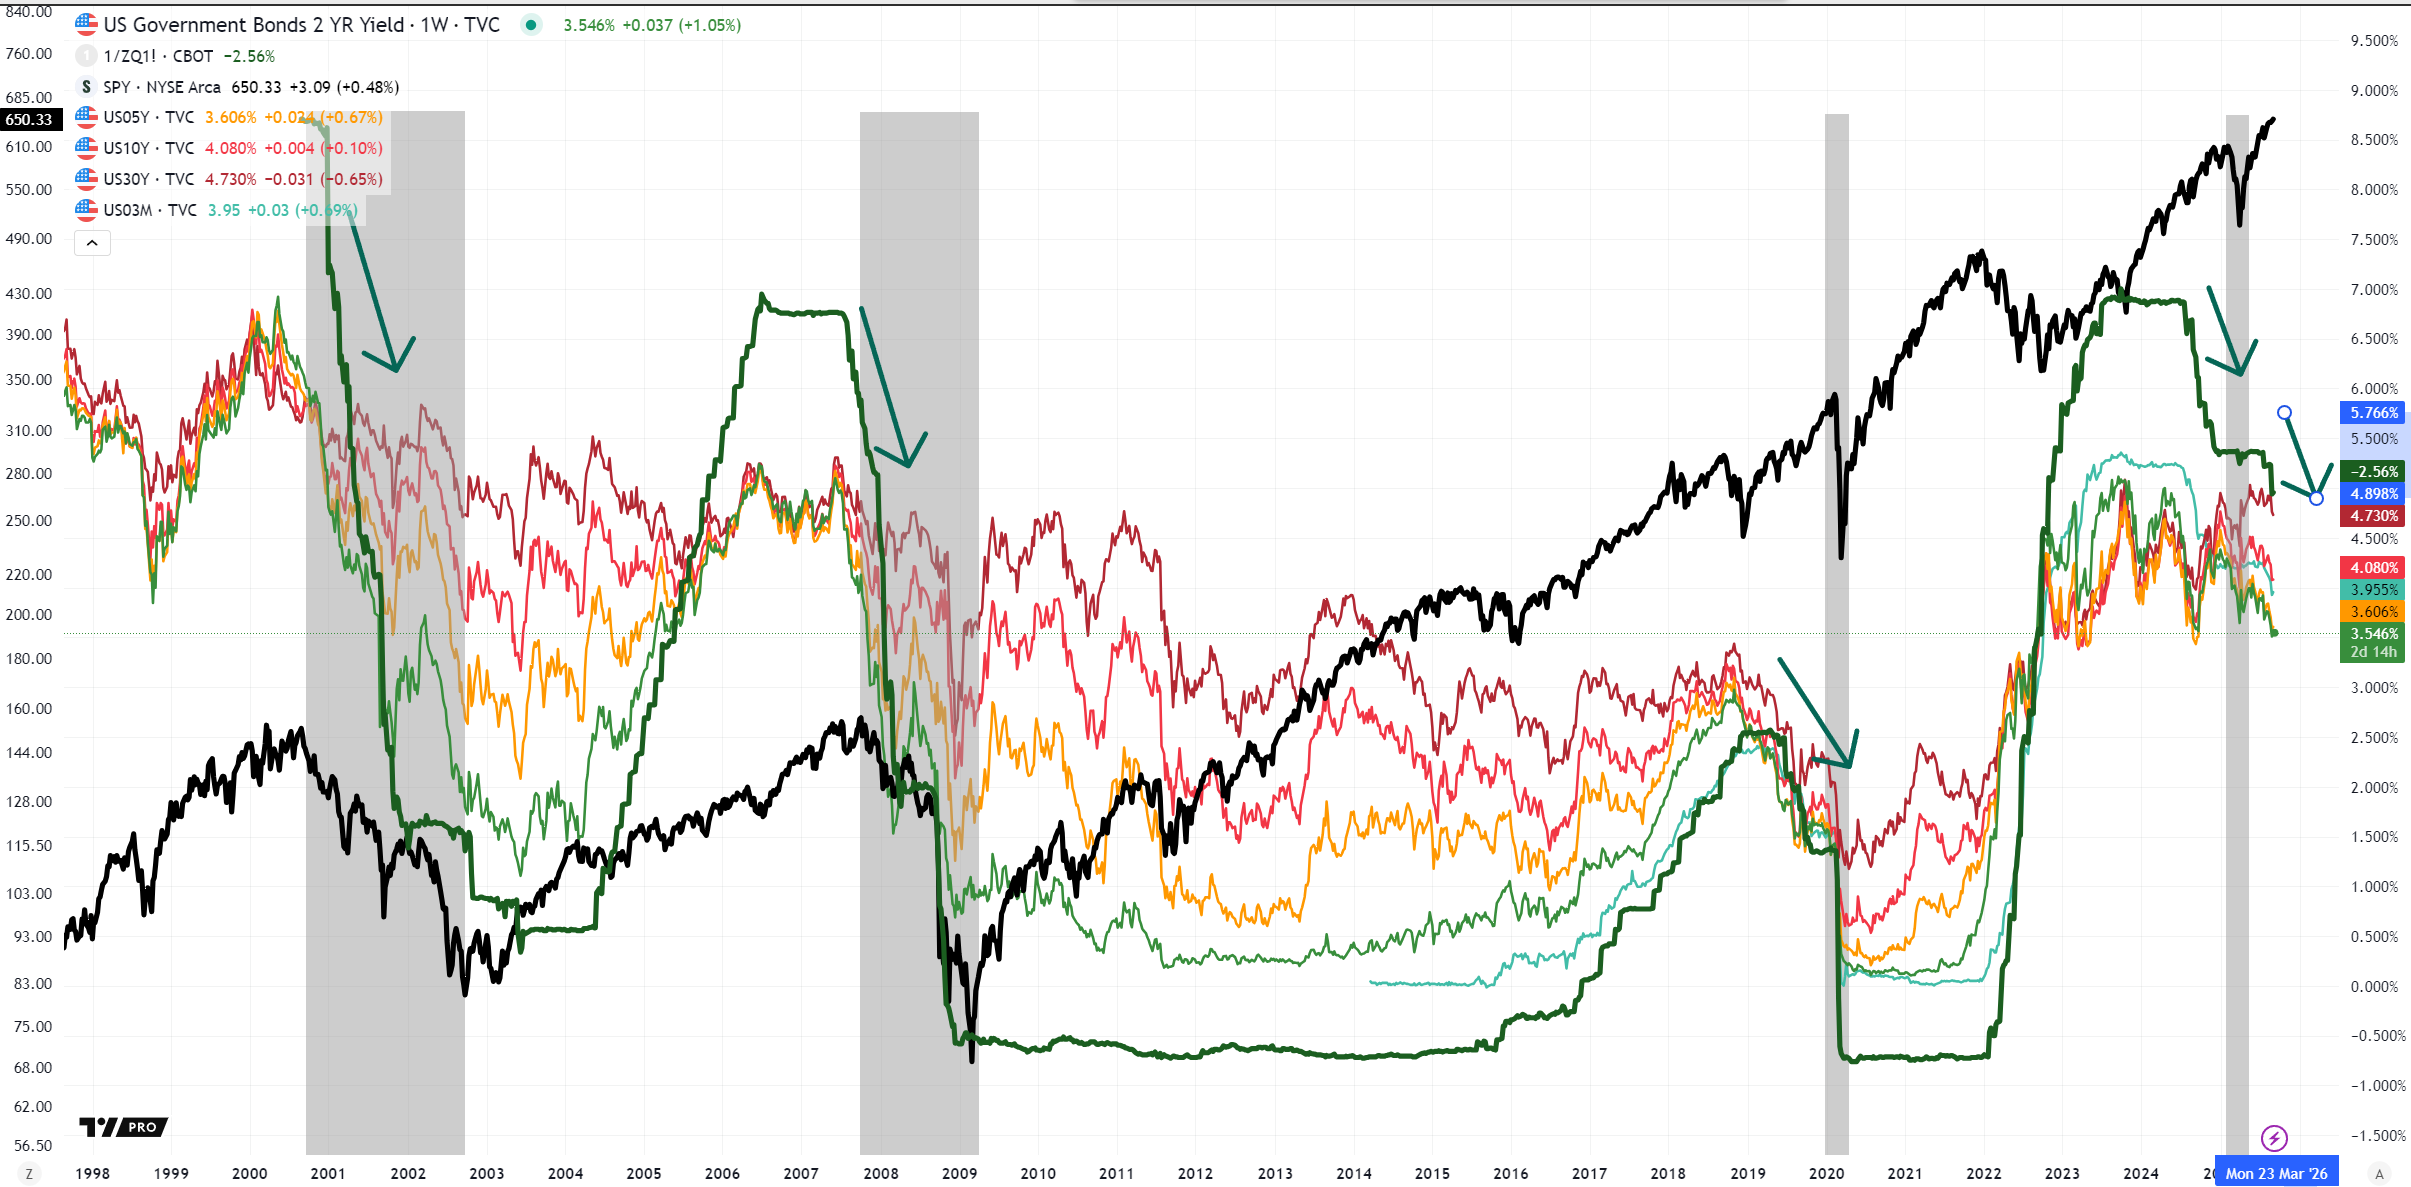
After FED Fund yields enter decline-phases, often heavy soll-offs in the stocks market are observed, often linked to recessions. -
ISM Manufacturing PMI
Manufacturing contracted in August (48.7), with both production and employment weakening.
Source: ISM -
ISM Services—Employment
The headline services PMI remained expansionary at 52.0, but employment contracted for a third consecutive month (46.5), signaling labor weakness in the largest U.S. sector.
| Metric | Aug 2025 | Signal |
|---|---|---|
| Services PMI | 52.0% | 🟡 |
| Business Activity | 55.0% | 🟢 |
| New Orders | 56.0% | 🟢 |
| Employment | 46.5% | 🔴 |
| Supplier Deliveries | 50.3% | 🟡 |
| Inventories | 53.2% | 🟡 |
| Prices Paid | 69.2% | 🟢 |
| Backlog of Orders | 40.4% | 🔴 |
Sources: ISM Services, TD Economics
-
Industrial Production
Production has stagnated through mid-2025. Flat to declining output across sectors often precedes GDP slowdowns.
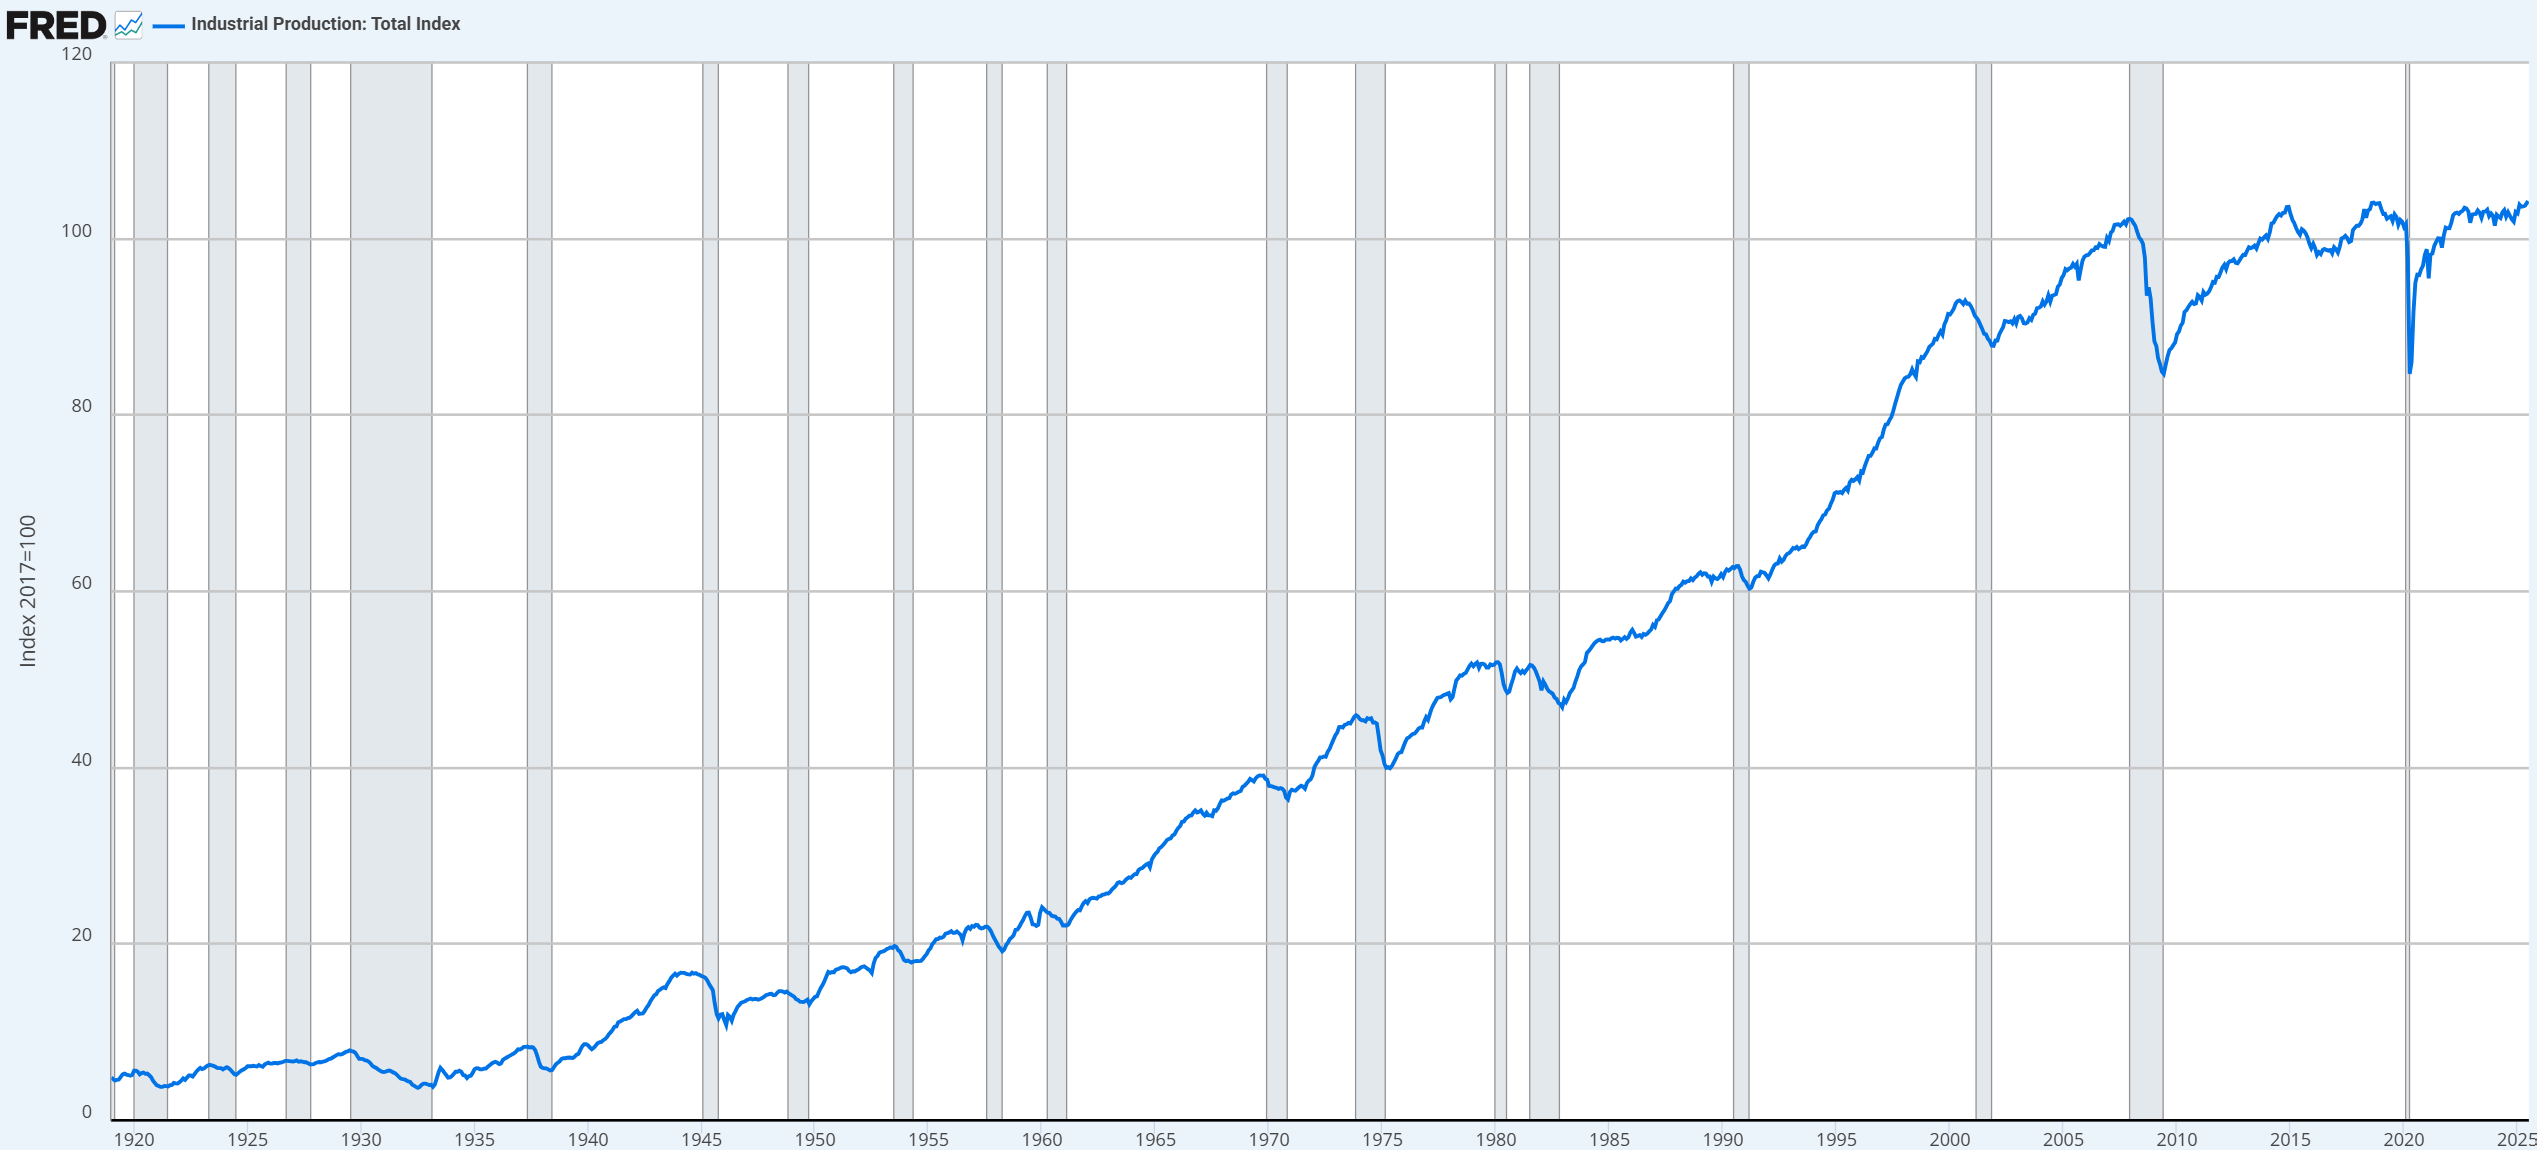
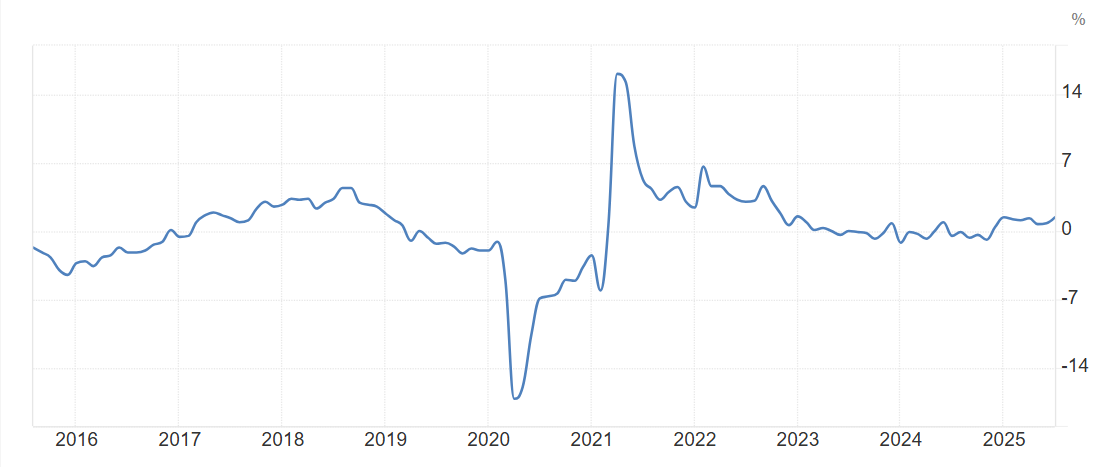
Source: FRED INDPRO -
Real Retail Sales / Consumption Pulse
Real sales have cooled relative to early 2025, with Chicago Fed CARTS showing weaker growth. Consumption fatigue appears to be undermining the cycle’s last leg.
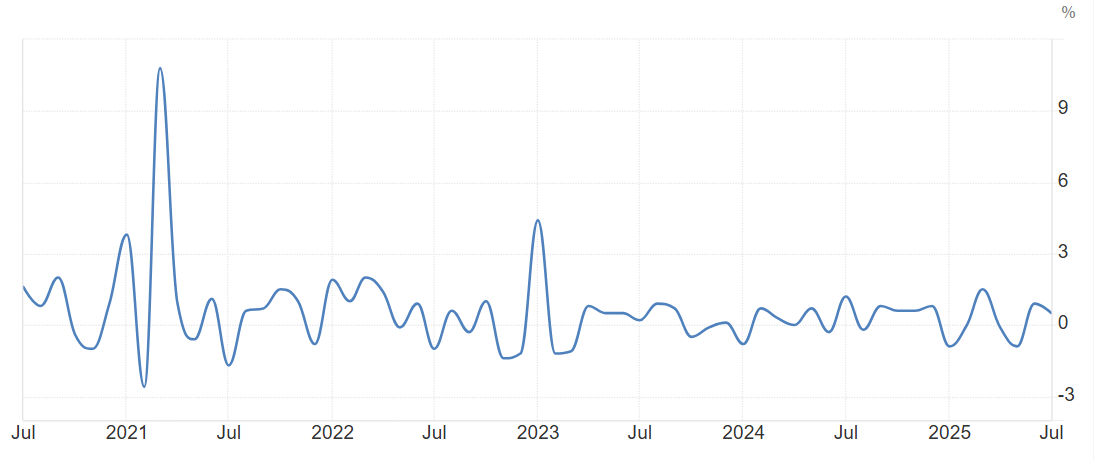
Sources: FRED RRSFS, Chicago Fed CARTS -
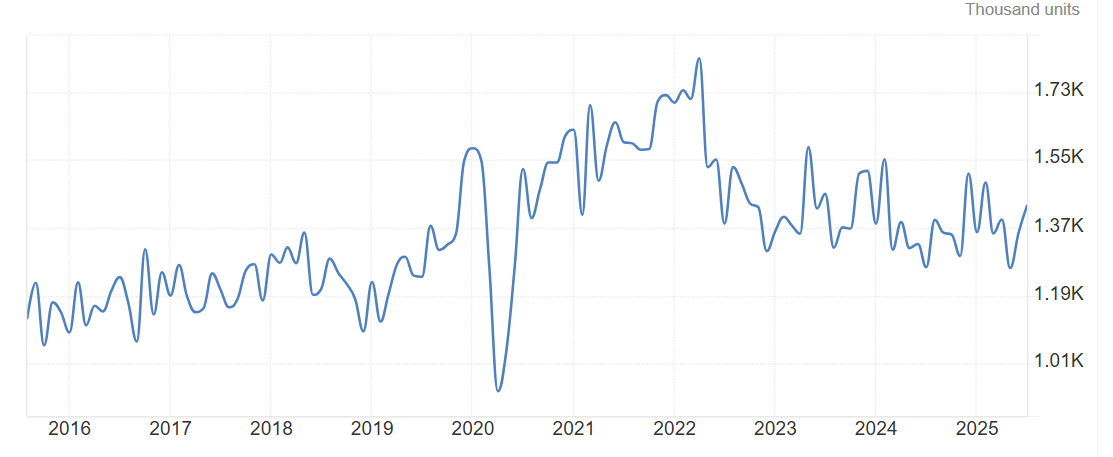
Housing Starts / Permits
Housing starts softened through summer, a classic early-cycle drag.
Optimistic View: Analysts expect the U.S. housing market will avoid a crash in 2025. Prices should rise modestly, mortgage rates remain in the 6–7% range, and inventory gradually improve.
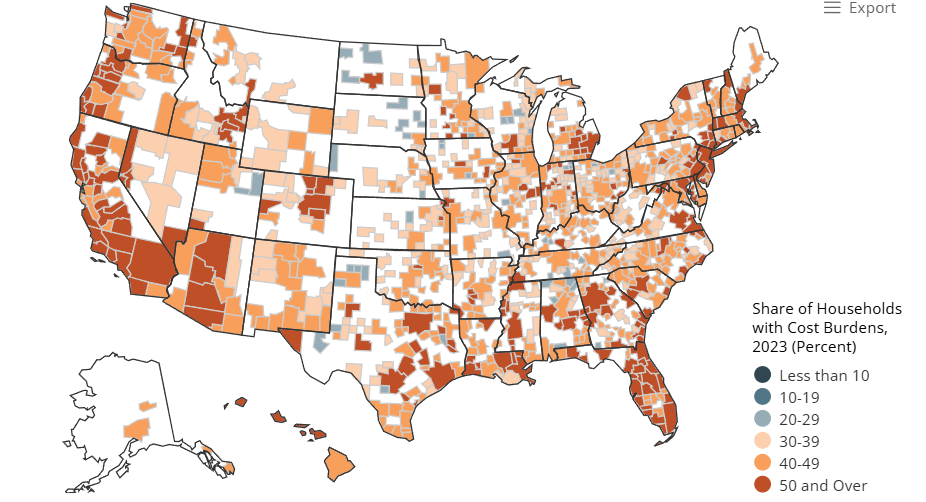
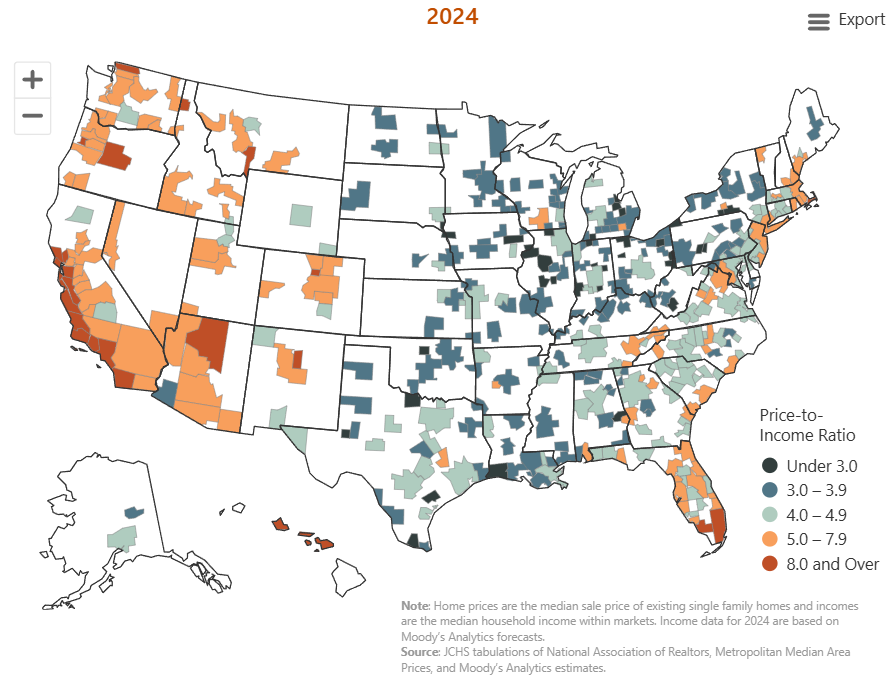
Critical View: Harvard’s State of the Nation’s Housing 2025 reports sales at a 30-year low, affordability at crisis levels, and rising renter burdens, with homelessness at record highs.
- Construction Costs
Mortenson’s Q2 2025 Construction Cost Index shows nonresidential costs rising 2.72% quarterly and 5.42% y/y. Labor and materials remain inflationary, while shipping costs have eased. Regional variation is high, with Denver seeing the largest increases.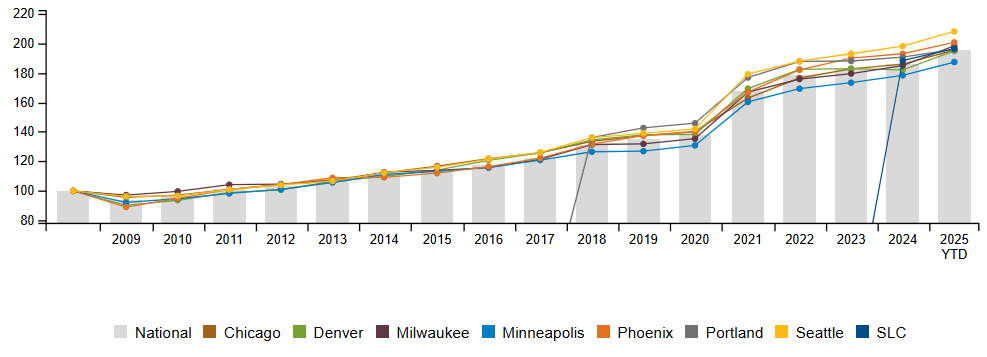
Construction costs in 2025 are being driven upward primarily by soaring materials prices (notably copper, aluminum, steel, and lumber), labor shortages—especially in skilled trades—with rising wage costs, and tariff and trade-related volatility that compounds input-cost inflation. Persistent supply chain disruptions and extended lead times for equipment and specialized components further inflate project budgets, while regional competition and growing demand in sectors such as industrial and data centers add pressure on both labor and materials. Together, these factors are expected to sustain sector-wide cost increases in the 5–7% range. Different, to the US President’s opinion, Loan Costs are not the main driver of increasing housing costs, but rather his own policies regarding trade and global supply chains.
| Cost Driver | Estimated Share | Notes |
|---|---|---|
| Materials (metals, lumber, cement) | 35% | Rising prices for copper, steel, aluminum, lumber; tariff-sensitive. |
| Labor (skilled trades) | 25% | Persistent labor shortages and higher wage agreements. |
| Tariffs / Trade impacts | 12% | Import duties and trade frictions raising input costs. |
| Supply Chain / Lead Time | 8% | Delays and higher costs for equipment and specialized components. |
| Regional Demand Pressures | 10% | Strong demand from industrial and data center projects lifting costs. |
| Loan Costs / Yields Impact | 10% | Higher financing costs due to elevated interest rates and tighter credit. |
Sources: Construction Dive (PPI, materials), Gordian—Construction Cost Insights Q2 2025 (labor, materials), Baldwin CPAs (tariffs, supply chain risks).
-
Credit Conditions (SLOOS)
July survey data show lending standards remain tight by historical norms and loan demand weak, constraining investment.
Sources: Fed SLOOS, FRED Tightening -
Household Debt & Delinquencies
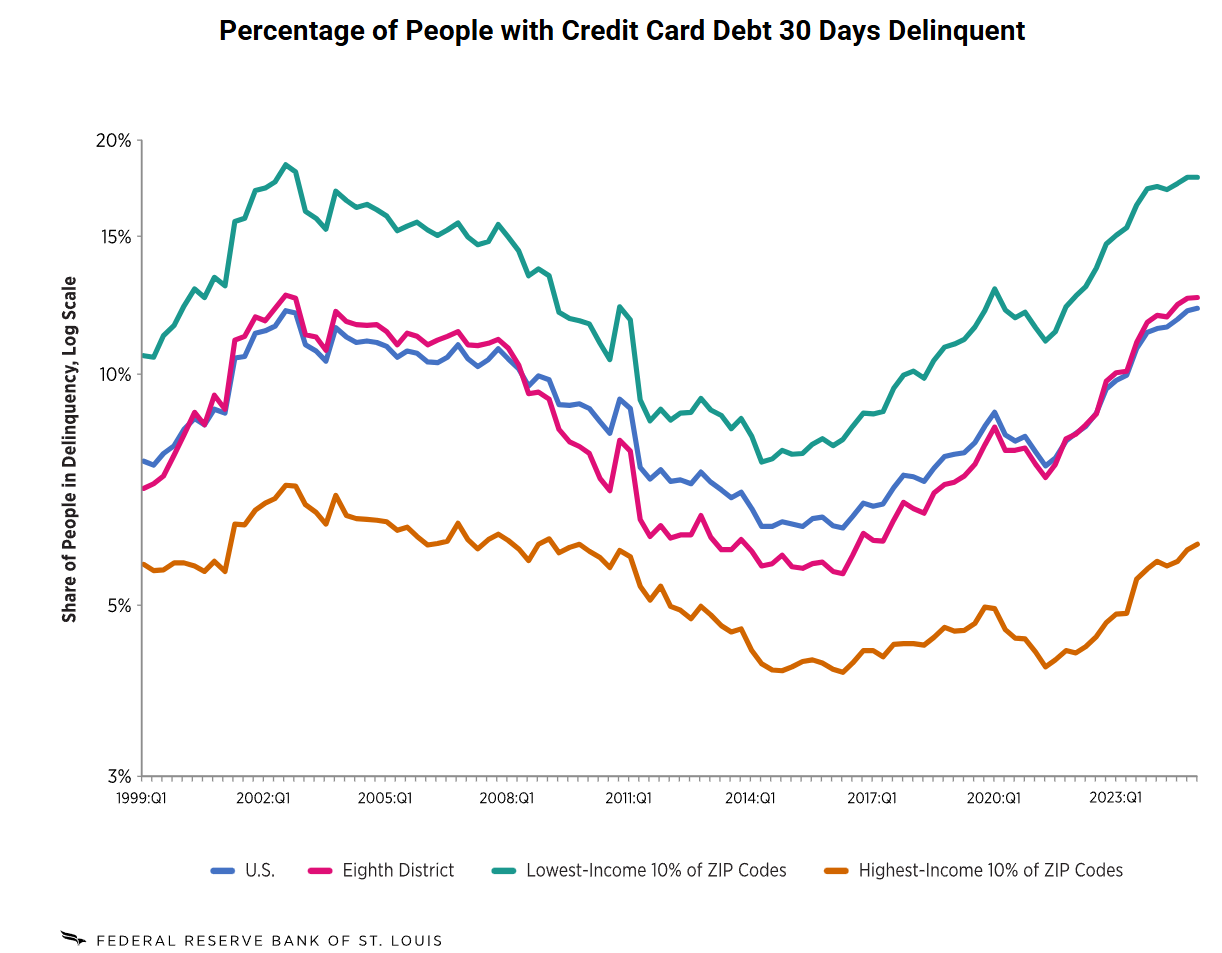
Household debt reached $18.39T in Q2 2025, with delinquencies rising across categories, notably student loans. The St. Louis Fed highlights credit card delinquencies at pre-2008 levels, with 12.1% of people and 14.1% of debt 30+ days past due.
Signs of a Possible Economic Upswing
While most leading indicators continue to flash recessionary risks, a few data points suggest that the U.S. economy may be entering a short phase of stabilization or even mild recovery:
- Services Strength: The ISM Non-Manufacturing PMI rose to 52.0 in August, with New Orders at 56.0, indicating a renewed demand impulse in the service sector (Reuters).
- Coincident Data: The Conference Board Coincident Index (CEI) edged up 0.2% in July, hinting at a modest rebound in real economic activity despite headwinds in labor markets (Conference Board).
- GDP Momentum: U.S. GDP expanded at an annualized pace of roughly 3% in Q2, a notable improvement from Q1, underscoring resilience in consumption and business investment (McKinsey).
- Technology Tailwinds: A surge in AI- and technology-related investment is driving productivity and corporate profit expectations, potentially cushioning cyclical weakness (Investopedia).
Interpretation: These developments do not negate the broad set of recession warnings, but they provide evidence that the economy retains areas of strength. The combination of resilient services activity, solid GDP growth, and technology-driven investment could deliver a temporary upswing—even as structural risks from labor markets, credit stress, and housing affordability persist.
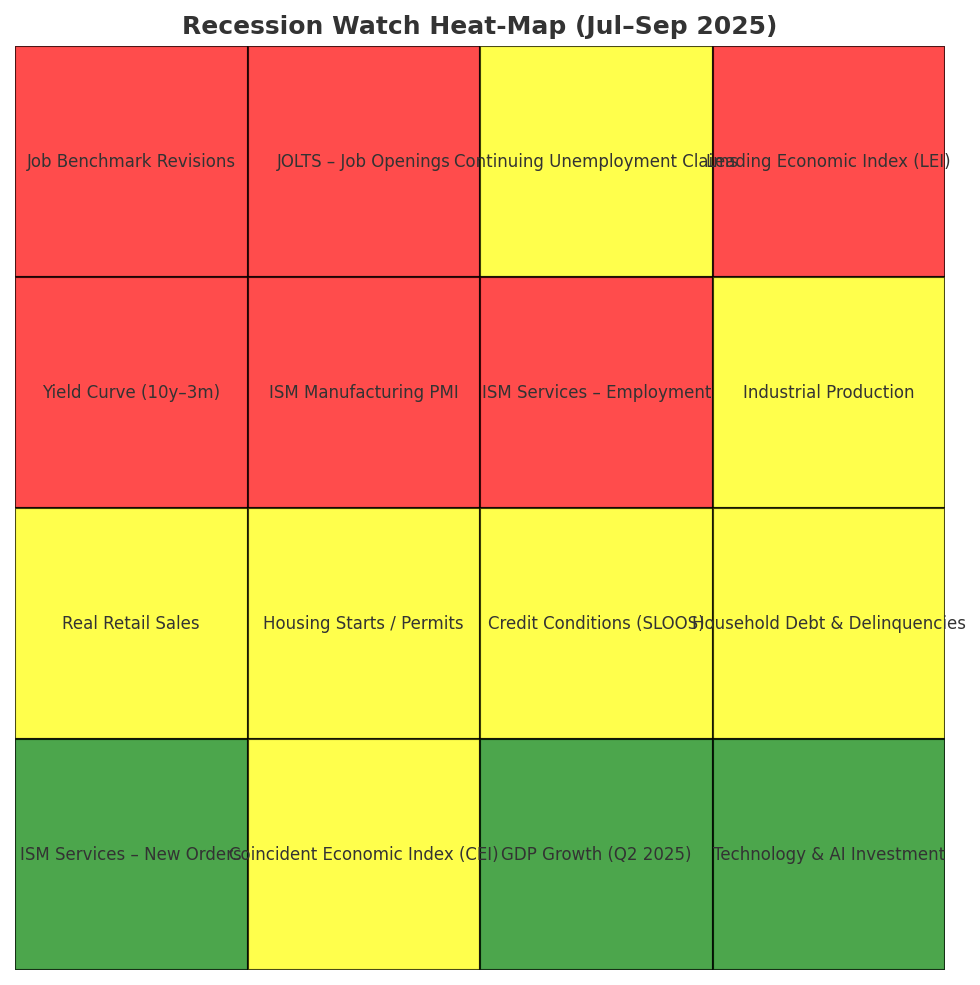
Recession Watch Summary: Heat-Map of Key Economic Indicators (Jul–Sep 2025)
| Indicator | Status (Heat Color) | Interpretation | Source (Chart Link) |
|---|---|---|---|
| Job Benchmark Revisions | 🔴 Red | Down 911K jobs through Mar 2025 — historic weakening | Reuters |
| JOLTS – Job Openings | 🔴 Red | Openings dropped to 7.437M in Jun; first time unemployed > openings | AP News |
| Continuing Unemployment Claims | 🟡 Yellow | Claims are rising, but still moderate | FRED Continued Claims |
| Leading Economic Index (LEI) | 🔴 Red | Jul LEI fell 0.1% (98.7) and −2.7% over 6 months — persistent decline | Conference Board LEI |
| Yield Curve (10y–3m) | 🔴 Red | Still deeply inverted — historically a reliable recession predictor | FRED 10y–3m |
| ISM Manufacturing PMI | 🔴 Red | At 48.7 in Aug — clearly in contraction territory | ISM Manufacturing |
| ISM Services – Employment | 🔴 Red | Employment sub-index at 46.5, third month of contraction | ISM Services |
| Industrial Production | 🟡 Yellow | Flat-to-down since spring; early-cycle warning | FRED Industrial Production |
| Real Retail Sales | 🟡 Yellow | Cooling vs early 2025; signs of consumption fatigue | FRED Real Retail Sales |
| Housing Starts / Permits | 🟡 Yellow | Softening summer builds — early recession indicator | FRED Housing Starts |
| Credit Conditions (SLOOS) | 🟡 Yellow | Standards remain tight; loan demand weak — discouraging investment | Fed SLOOS |
| Household Debt & Delinquencies | 🟡 Yellow | Rising delinquencies, especially in student loans; stress building | NY Fed Household Debt |
| ISM Services – New Orders | 🟢 Green | New Orders at 56.0 in Aug — strong demand impulse in services | Reuters |
| Coincident Economic Index (CEI) | 🟡 Yellow | Rose 0.2% in Jul — hinting at stabilization | Conference Board |
| GDP Growth (Q2 2025) | 🟢 Green | Annualized growth of 3%, stronger than Q1 | McKinsey |
| Technology & AI Investment | 🟢 Green | Productivity and corporate profit tailwinds from tech boom | Investopedia |
Summary
The U.S. economy shows broadening signs of strain: labor markets are weakening, the LEI continues to fall, the yield curve remains distorted, manufacturing and industrial output are stagnating, and consumer delinquencies are rising. Housing remains bifurcated—prices are stable in some regions, but affordability pressures are at crisis levels. Construction costs add further stress. While the S&P 500 remains resilient, the combined signals suggest that the economy is moving steadily closer to recession.