— date: ‘2025-09-06’ title: “US Labor Market: Signs of Weakening Beneath the Surface” tags: [NFP, Unemployment, Youth, Construction, Labor Market, Revisions, CPI, GDP, ISM, Fed Policy]
Market Overview
The week of September 8–12 will be pivotal as investors brace for critical economic data ahead of the September 16–17 FOMC meeting. Last week’s disappointing jobs report reinforced the narrative of a weakening labor market, shifting attention squarely to inflation data and payroll benchmark revisions that could reset expectations for monetary policy.
Market Analysis
The Weekly SP500 Indicator declined again, issuing a clear warning signal: the second distribution week in the past six weeks. For comparison, the topping phase before the early 2025 sell-off lasted 11 weeks and showed three distribution weeks. Market internals are therefore pointing to increasing fragility.
Background Story 1: Labor Market Flashing Red
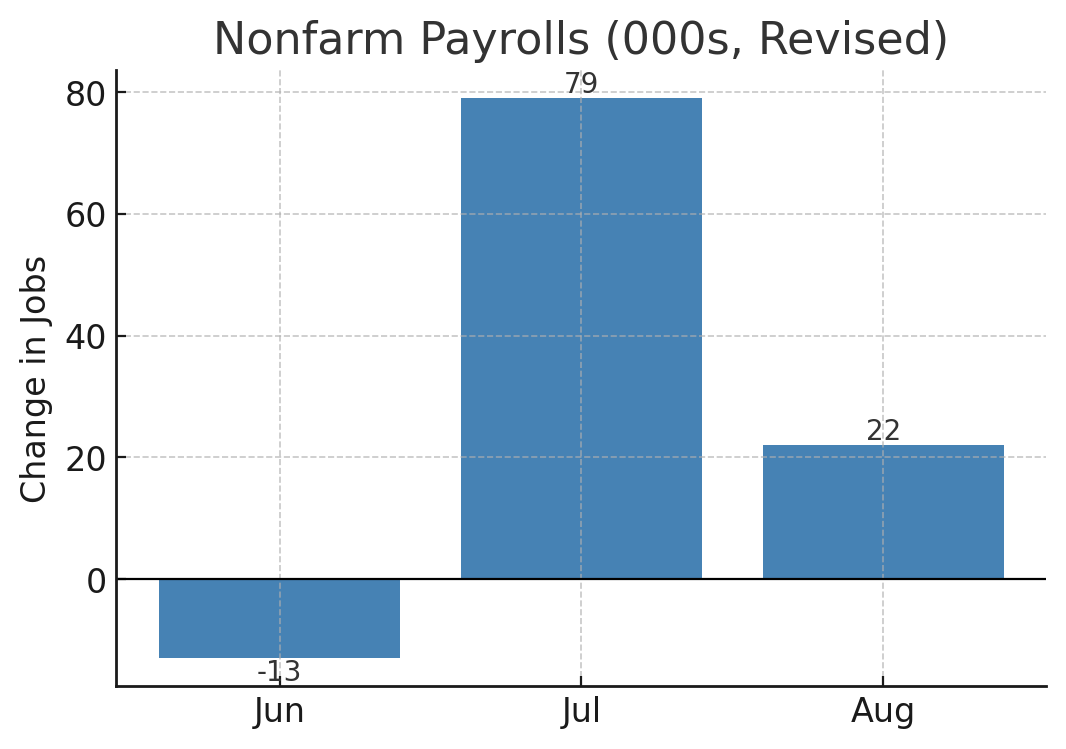
The August Nonfarm Payrolls (NFP) report showed only +22k jobs, while June was revised to –13k (the first monthly decline since 2020) and July lowered to +79k. These revisions removed momentum and left a net –21k adjustment. The unemployment rate rose to 4.3%, its highest since 2021, with 7.4 million people unemployed (BLS).
Labor force participation held steady at 62.3%, while the employment-population ratio slipped to 59.6%. Wages rose +0.3% m/m, +3.7% y/y, but the average workweek remained at 34.2 hours, highlighting subdued demand for labor.
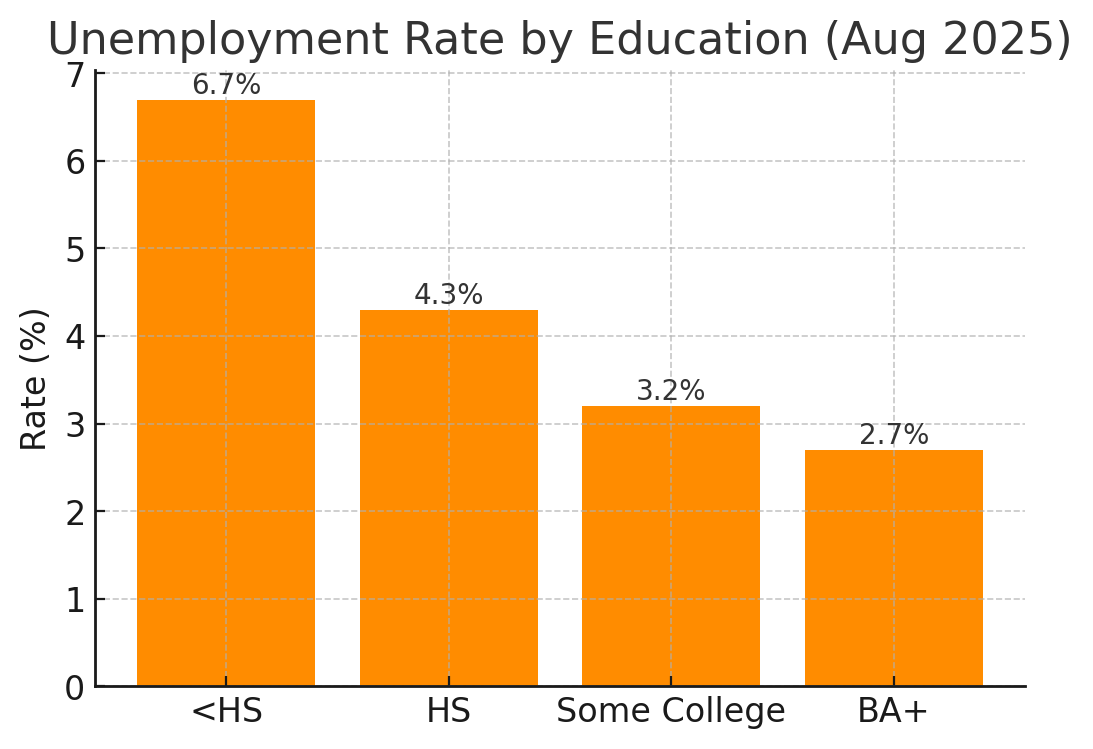
Youth unemployment rose to 10.8% in July, above 9.8% a year earlier. Disparities remain across groups: White 3.7%, Black 7.5%, Asian 3.6%, Hispanic 5.3%. Workers without a high school diploma face 6.7% unemployment, compared to 2.7% for college graduates.
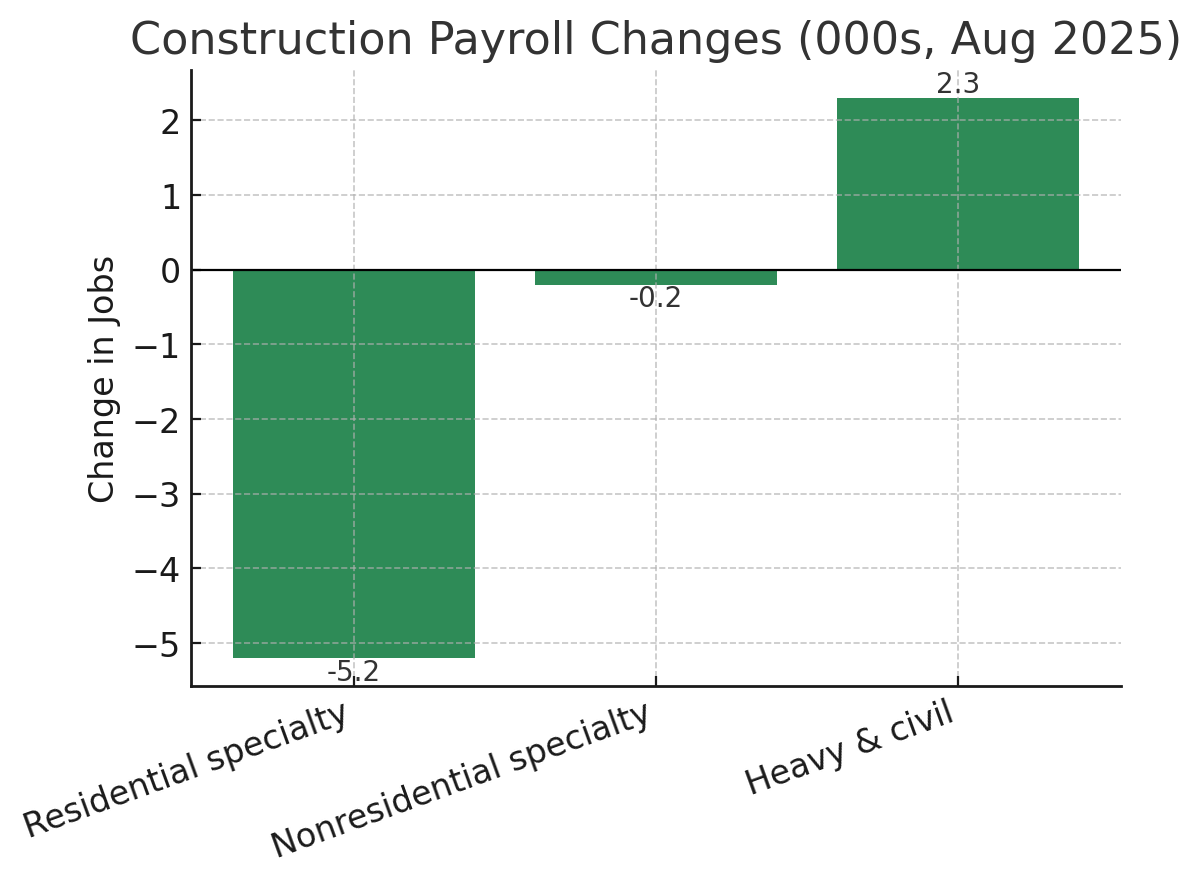
The construction sector lost 7,000 jobs, its third straight monthly decline. Losses were concentrated in residential specialty trades (–5.2k), with only heavy and civil engineering (+2.3k) showing growth. Rising financing costs and weaker housing demand are weighing heavily on the sector.
Long-term unemployment rose to 1.93m (25.7% of the total), with the average duration at 24.5 weeks. The number of people wanting a job but not in the labor force increased to 6.4m, up +722k y/y. JOLTS showed openings down to 7.2m, with quits and hires both subdued.
Background Story 2: The Economy in 2025 – Slowdown with Pockets of Growth
The growth profile in 2025 is uneven. After a contraction of –0.5% saar in Q1, GDP rebounded to +3.3% saar in Q2, driven largely by consumption and import dynamics (BEA).
Inflation pressures have cooled materially: July CPI rose just 0.2% m/m and 2.7% y/y, with core CPI 3.1% y/y. Real hourly earnings improved by 1.2–1.3% y/y (BLS Real Earnings).
Signs of Weakness
- Labor: Hiring nearly stalled in August, unemployment rose, and job openings fell to multi-year lows.
- Manufacturing: ISM Manufacturing PMI dropped to 48.7 (contraction).
- Confidence: The University of Michigan consumer sentiment index fell to 58.2 in August, slipping both m/m and y/y.
Signs of Resilience
- Services: ISM Services PMI at 52.0, signaling modest expansion.
- Consumption: Retail sales rose +0.5% m/m, +3.9% y/y in July.
- Housing: Housing starts climbed +5.2% m/m and +12.9% y/y; single-family starts +2.8% m/m.
At-a-Glance: Key US Economic Metrics (2025)
| Indicator | Latest Data (mid-2025) | Trend / Implication |
|---|---|---|
| GDP | Q1 –0.5% saar; Q2 +3.3% saar (BEA) | Choppy growth; uneven momentum |
| Payrolls (NFP) | +22k Aug; June revised –13k (BLS) | Hiring stalled; revisions show weakness |
| Unemployment | 4.3% (Aug, 7.4m people) | Highest since 2021; upward drift |
| Job Openings | 7.2m (Jul) (JOLTS) | Multi-month low; demand cooling |
| Manufacturing | ISM PMI 48.7 (Aug) (ISM) | Contraction territory |
| Services | ISM PMI 52.0 (Aug) (ISM) | Still expanding, modestly |
| Inflation (CPI) | +0.2% m/m, +2.7% y/y Jul; Core 3.1% (BLS CPI) | Disinflation continues |
| Real Earnings | +1.2–1.3% y/y (Jul) (BLS Real Earnings) | Household purchasing power improving |
| Retail Sales | +0.5% m/m, +3.9% y/y Jul (Census) | Consumers still spending |
| Housing Starts | +5.2% m/m, +12.9% y/y Jul (Census Housing) | Rebound despite higher rates |
| Consumer Sentiment | 58.2 (Aug) (Michigan) | Weak confidence, slipping expectations |
Final Summary
The U.S. economy is sending mixed signals as summer 2025 draws to a close. The labor market is flashing red, with hiring stagnating, unemployment drifting higher, and revisions pointing to previously overstated strength. Structural disparities—across age, race, and education—are widening, while construction jobs highlight sensitivity to tighter financing conditions.
At the same time, parts of the economy are still expanding. Services remain in growth territory, retail spending is resilient, real wages are improving, and housing starts have rebounded. Inflation has cooled into the 2–3% range, giving the Fed scope to ease policy.
The key risk is policy miscalibration. Markets are fully pricing in a 25 bp cut at the September FOMC. However, if the Fed surprises with a 50 bp cut, which is not currently priced, it could spook investors by signaling deeper concern about the economy, potentially triggering a sharp risk-off sell-off.
In short, the balance of evidence suggests a late-cycle slowdown: growth is softer, disinflation is cushioning households, but the labor market is no longer a reliable pillar of resilience. The Fed’s response next week will set the tone for markets into year-end.