Market Analysis
Due to Labor Day, U.S. stock exchanges remained closed yesterday, while futures trading continued with limited liquidity. Retail flows dominated Monday’s session as the NYSE, Nasdaq, U.S. banks, and government agencies were shut. Current SP500 Indicator values carry a high degree of uncertainty, as several inputs are missing. Still, the indicator ticked slightly higher, mirroring a modest rise in the ES future.
On the daily chart, the ES remains trapped between 6400 and 6500. Multiple attempts to break to new all-time highs have been quickly reversed, and former leaders—Mega-Cap Tech stocks—have now turned into laggards. This shift is not purely bearish: market breadth is improving, with capital rotating into cyclicals and rate-sensitive sectors expected to benefit most from upcoming Fed cuts. In other words, the previous regime of rising indices driven by a few stocks may give way to broader participation—even if index levels stall under Big Tech’s market-cap dominance.
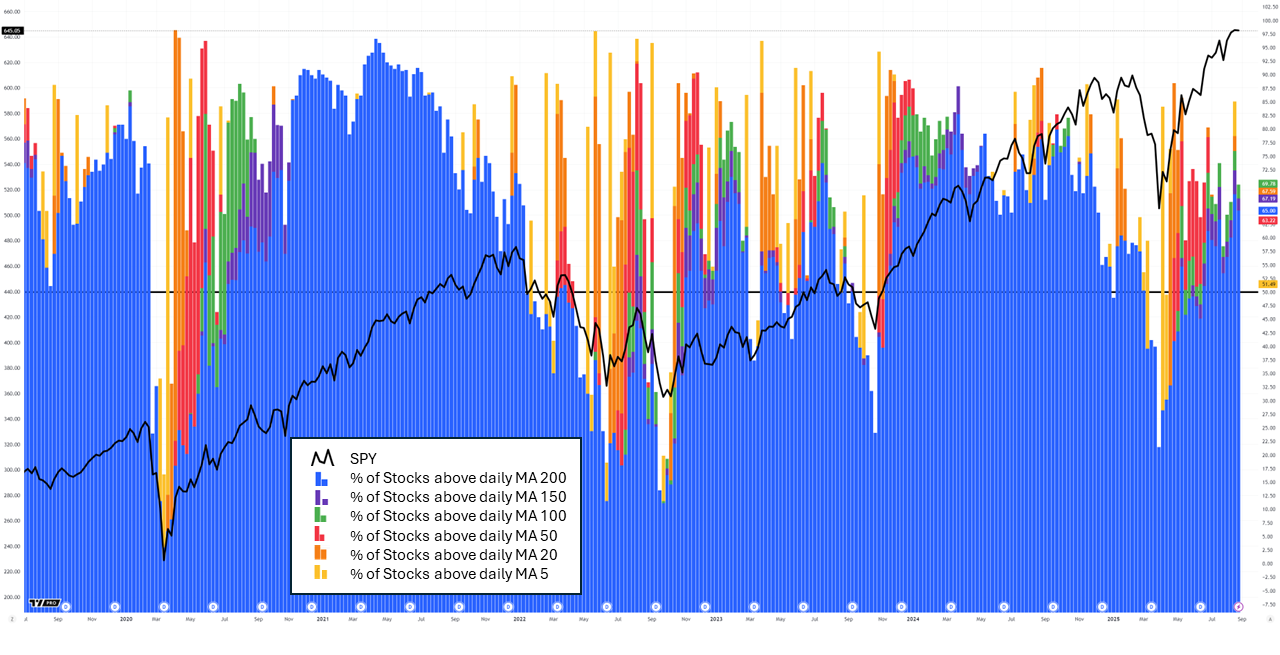
The breadth-cycle suggests that we have arrived in the late-phase, where stocks still go up (former laggers). It will be crucial to watch the percentage of stocks above their daily 200 moving average. If it starts to decline, it may signal the end of the current bull-run.
Technical Analysis
Elliott Wave analysis of the S&P reveals a series of concerning patterns.
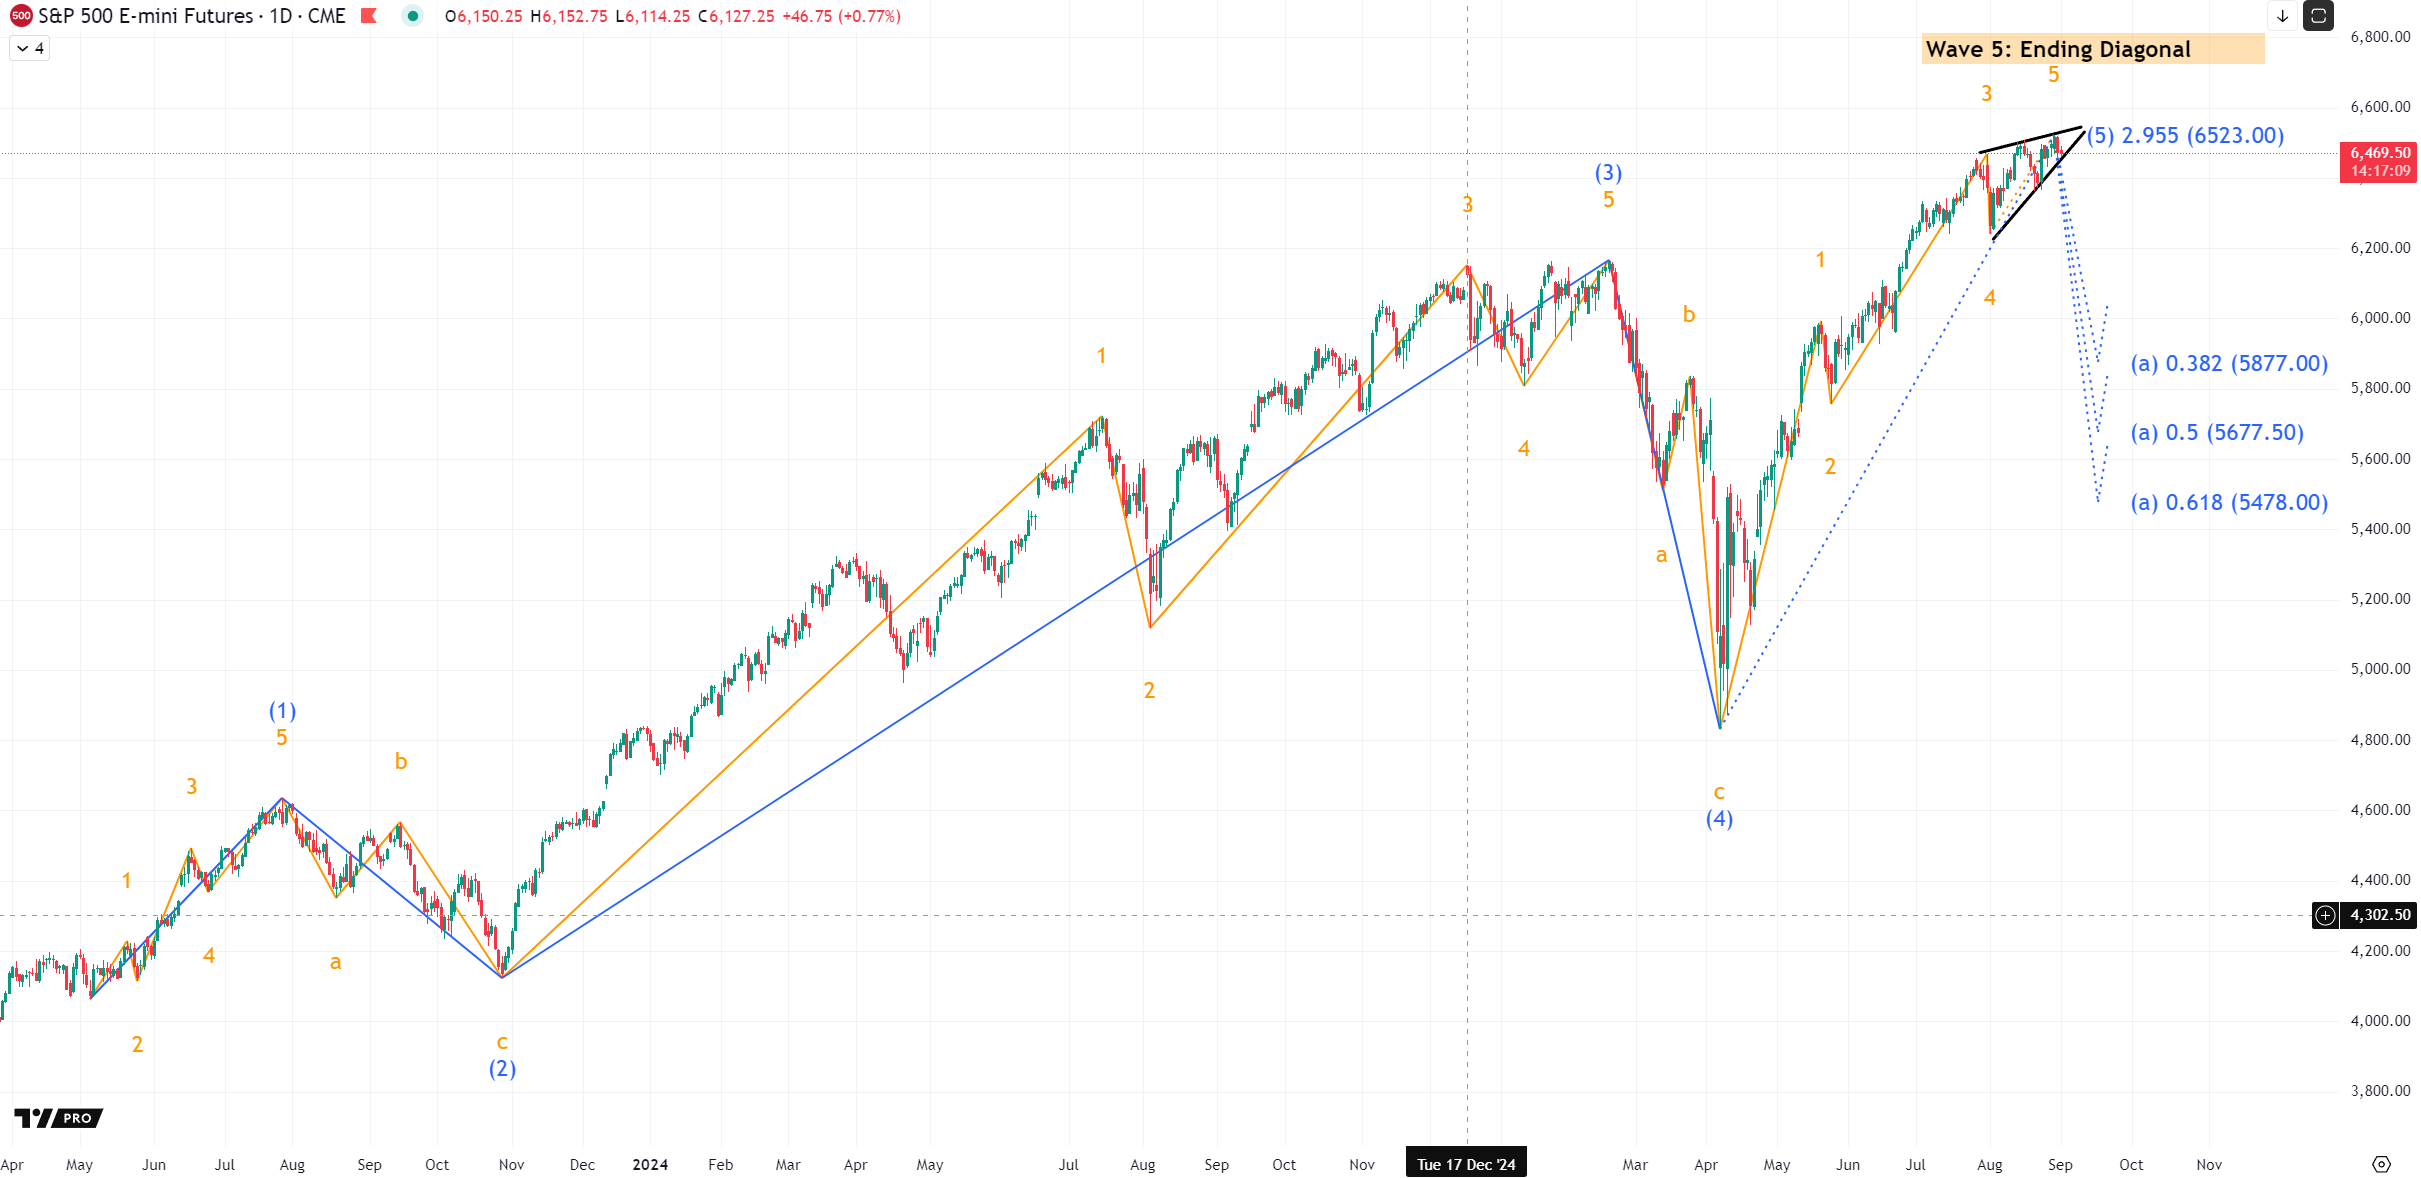
The most striking feature is the Ending Diagonal pattern, highlighted by the two black lines. An Ending Diagonal is a wedge-shaped formation in Elliott Wave theory that typically emerges in the final stages of a larger move—either the fifth wave of an impulse or the “C” wave of a correction. It is defined by overlapping sub-waves, converging or diverging trendlines, and fading momentum, all pointing to trend exhaustion. Once complete, the pattern is often followed by a sharp reversal back to the origin of wave one, as liquidity and positioning unwind rapidly. Historical studies suggest that an Ending Diagonal resolves into a bearish reversal in about 65% of cases when it forms at the end of an upward move, and into a bullish reversal in roughly 70% of cases when it develops at the end of a downward move. This does not exclude the possibility of another ATH in the coming days before a breakdown.
The second observation is that markets may simply be in the fifth wave of the recovery from the April 2025 lows (five upward waves shown in orange). Statistically, a fifth-wave top results in a downward correction in approximately 60–65% of historical cases, with retracements often extending to at least one-third of the prior advance.
The third observation stems from the long-term Elliott Wave count (blue line), which tracks multiple upward waves beginning in May 2023, right after the 2022 bear market bottom. On this extended horizon, the market also appears to be in the fifth and final up-wave. Historically, terminal fifth waves have produced corrective declines in about 70% of cases, with retracements toward Fibonacci levels of 32% (5877), 50% (5677), or even 61.8% (5478) being statistically common.
Notably, the 32% retracement zone aligns with key market clusters: it overlaps with the Accumulation/Distribution zones identified by the SP500 Indicator (the 6000 BUY-zone and the 5900 YTD-level, where heavy trade clusters have formed). This area also coincides with the 200-day moving average, reinforcing its significance as a potential support level.
What to watch this week: Labor Data and Policy Signals in Focus
United States
All eyes are on Friday’s release of the August Nonfarm Payrolls (NFP)—a high-stakes event that could decisively impact September Fed rate-cut expectations.
Markets will also track a sequence of labor data:
- Tuesday – JOLTS Job Openings (July): Labor demand expected to soften further.
- Wednesday – ADP Private Payrolls (August): Forecast 150–170k jobs.
- Thursday – Weekly Jobless Claims & ISM Services PMI: Claims seen edging higher; ISM Services 52.0.
Additional data includes ISM and S&P Global PMIs, construction spending, factory orders, and the Fed’s Beige Book.
A persistent labor slowdown—negative revisions, weaker hiring, softer wages—would reinforce dovish expectations. A sub-150k NFP print could trigger initial weakness in ES futures, then a relief rally on easing hopes. Conversely, a strong report (200k+) risks undermining the dovish consensus and tightening financial conditions.
Weekly Event Calendar – United States
| Day | Event | Expectations | Potential ES Reaction (pts) | Analyst-Estimated Move in ES |
|---|---|---|---|---|
| Tuesday | JOLTS Job Openings (Jul) | Further decline | Weak → ES modestly positive | ≈ +2 to +5 pts |
| Wednesday | ADP Employment (Aug) | 150–170k jobs | Soft → bullish; Strong → cautious | ±5 to ±10 pts |
| Thursday | Jobless Claims / ISM Services | Claims higher, ISM 52.0 | Softer data supports ES | ≈ +3 to +8 pts |
| Friday | Nonfarm Payrolls (Aug) | 160k jobs, unemployment 4.3% | <150k → ES rallies; >200k + strong wages → sell-off | ±10 to ±20 pts |
Europe and Global
Eurozone manufacturing expanded for the first time since early 2022, with the Composite PMI at 50.7. Germany’s PMI improved to 49.8, its strongest in over two years, though exports and employment remain weak.
ECB’s Isabel Schnabel confirmed policy is appropriately calibrated with inflation near 2%, while warning of risks from food, wages, and supply chains.
European equities opened the week higher, supported by PMI resilience, healthcare strength, and positive tech momentum from China (Alibaba’s AI-cloud).
Summary
- U.S.: Critical week with NFP and labor data likely shaping Fed policy expectations.
- Technical setup: Multiple Elliott Wave signals—Ending Diagonal, short- and long-term fifth waves—suggest rising downside risks, with corrective retracements statistically probable.
- Europe: PMI improvement signals tentative stabilization, while ECB remains steady.
- Markets: Breadth is improving, but Big Tech weakness could cap index gains.