Yield Curve Cycles
The FED and its 2 mandates
The Federal Reserve’s independence, established with the Federal Reserve Act of 1913, ensures that it sets monetary policy autonomously to pursue its dual mandate of price stability and maximum employment, free from direct political control. Today’s U.S. administration is attempting to bypass this framework not by abolishing the Fed, but by weakening it through political pressure on Fed officials, expanding the Treasury’s role in liquidity management, and promoting crypto-linked mechanisms such as a Bitcoin reserve and T-bill-backed stablecoins. These actions shift influence from an independent central bank toward the executive branch, raising long-term risks for inflation expectations, dollar credibility, and institutional trust.
- Price stability → Keep inflation low and stable, preserving the purchasing power of the dollar. If inflation runs too high, the Fed tightens policy (raise rates, shrink balance sheet).
- Maximum Employment → Promote conditions in which as many people as possible who want a job can find one. If unemployment rises sharply, the Fed eases policy (lower rates, provide liquidity).
Currently, maximum employment dominates over price stability, but it remains unclear how a protectionist and nationalist trade policy will affect US inflation. Historically, such a policy has led to the following consequences:
1. Inflation
Tariff-driven policies typically push inflation higher. Import duties raise the cost of intermediate goods and finished products, creating cost-push inflation as companies pass on higher input costs. While protected industries may benefit, the broader economy faces persistent upward price pressure.
2. Consumer Spending
Higher prices erode household purchasing power, leaving less disposable income for discretionary consumption. Consumers allocate more of their budgets to essentials such as food, energy, and housing, weighing on retail, leisure, and services.
3. Consumer Wellbeing
The combination of rising costs and reduced product choice diminishes overall consumer wellbeing. Without international competition, domestic producers may innovate less while charging higher prices. As real incomes decline, consumer confidence weakens and households adopt more cautious spending.
4. Jobs Market
The labor market impact is mixed. Tariffs can temporarily shield industries such as steel, autos, or agriculture, preserving jobs. Export-oriented industries, however, suffer when trading partners retaliate with counter-tariffs, leading to job losses in manufacturing and technology. In practice, these policies shift jobs across sectors rather than creating a net gain. The latest U.S. labor market data point to gradual cooling: unemployment expectations have risen toward 4.3–4.4%, the share of consumers saying jobs are “hard to get” has climbed to the highest since 2021, and hiring momentum is slowing. While business investment in equipment remains resilient, both consumer confidence and labor market sentiment have weakened, reinforcing expectations of Fed rate cuts in September.
5. Global Trade
Protectionist policies reduce trade volumes and disrupt supply chains. Retaliatory measures often spark trade wars, amplifying uncertainty for global companies. Firms are forced to reconfigure production networks, raising costs and lowering efficiency.
6. Global Economy
On a macro level, widespread protectionism slows global growth. Emerging markets reliant on U.S. exports are particularly vulnerable. Multinational companies
face margin compression, higher volatility, and weaker earnings visibility. Over time, this leads to reduced investment flows, tighter financial conditions, and a more fragile international economy.
The Central Bank Interest Rate Cycle
1. Tightening Phase (Rate Hikes)
When inflation rises above target or the economy overheats, central banks raise policy rates to slow activity. Higher borrowing costs dampen consumption and investment, cooling demand. In this phase, currencies often strengthen while equities and credit markets face headwinds.
2. Peak / Restrictive Plateau
After a series of hikes, rates are held at restrictive levels for a sustained period. The goal is to anchor inflation expectations and prevent renewed price pressures. This phase often puts pressure on housing, labor markets, and corporate balance sheets.
3. Easing Phase (Rate Cuts)
When growth slows and inflation approaches target, central banks cut rates. Lower borrowing costs improve credit conditions, stimulate demand, and support investment. Risk assets such as equities and bonds typically benefit, while currencies may weaken.
4. Neutral / Recovery Phase
Eventually, interest rates converge toward a “neutral” level — neither restrictive nor overly accommodative. At this stage, the economy stabilizes, and monetary policy becomes balanced. The cycle resets as central banks monitor for new risks.
Yield Curve Inversion and Implications
An inversion of the yield curve typically follows late-cycle tightening, when short-term policy rates exceed long-term growth and inflation expectations. Historically, inversions signal rising recession risks, as restrictive funding conditions weigh on credit and investment.
The cycle often unfolds in three stages:
1. Flattening as markets anticipate slower growth
2. Deep Inversion when the Fed keeps policy restrictive while long-end yields price in easing
3. Steepening as the curve normalizes — either through Fed cuts at the front end or renewed inflation risk at the long end
For investors, the key is distinguishing between a bull steepener (policy easing amid slowdown) and a bear steepener (inflation-led long-end selloff), as each carries very different implications for risk assets.
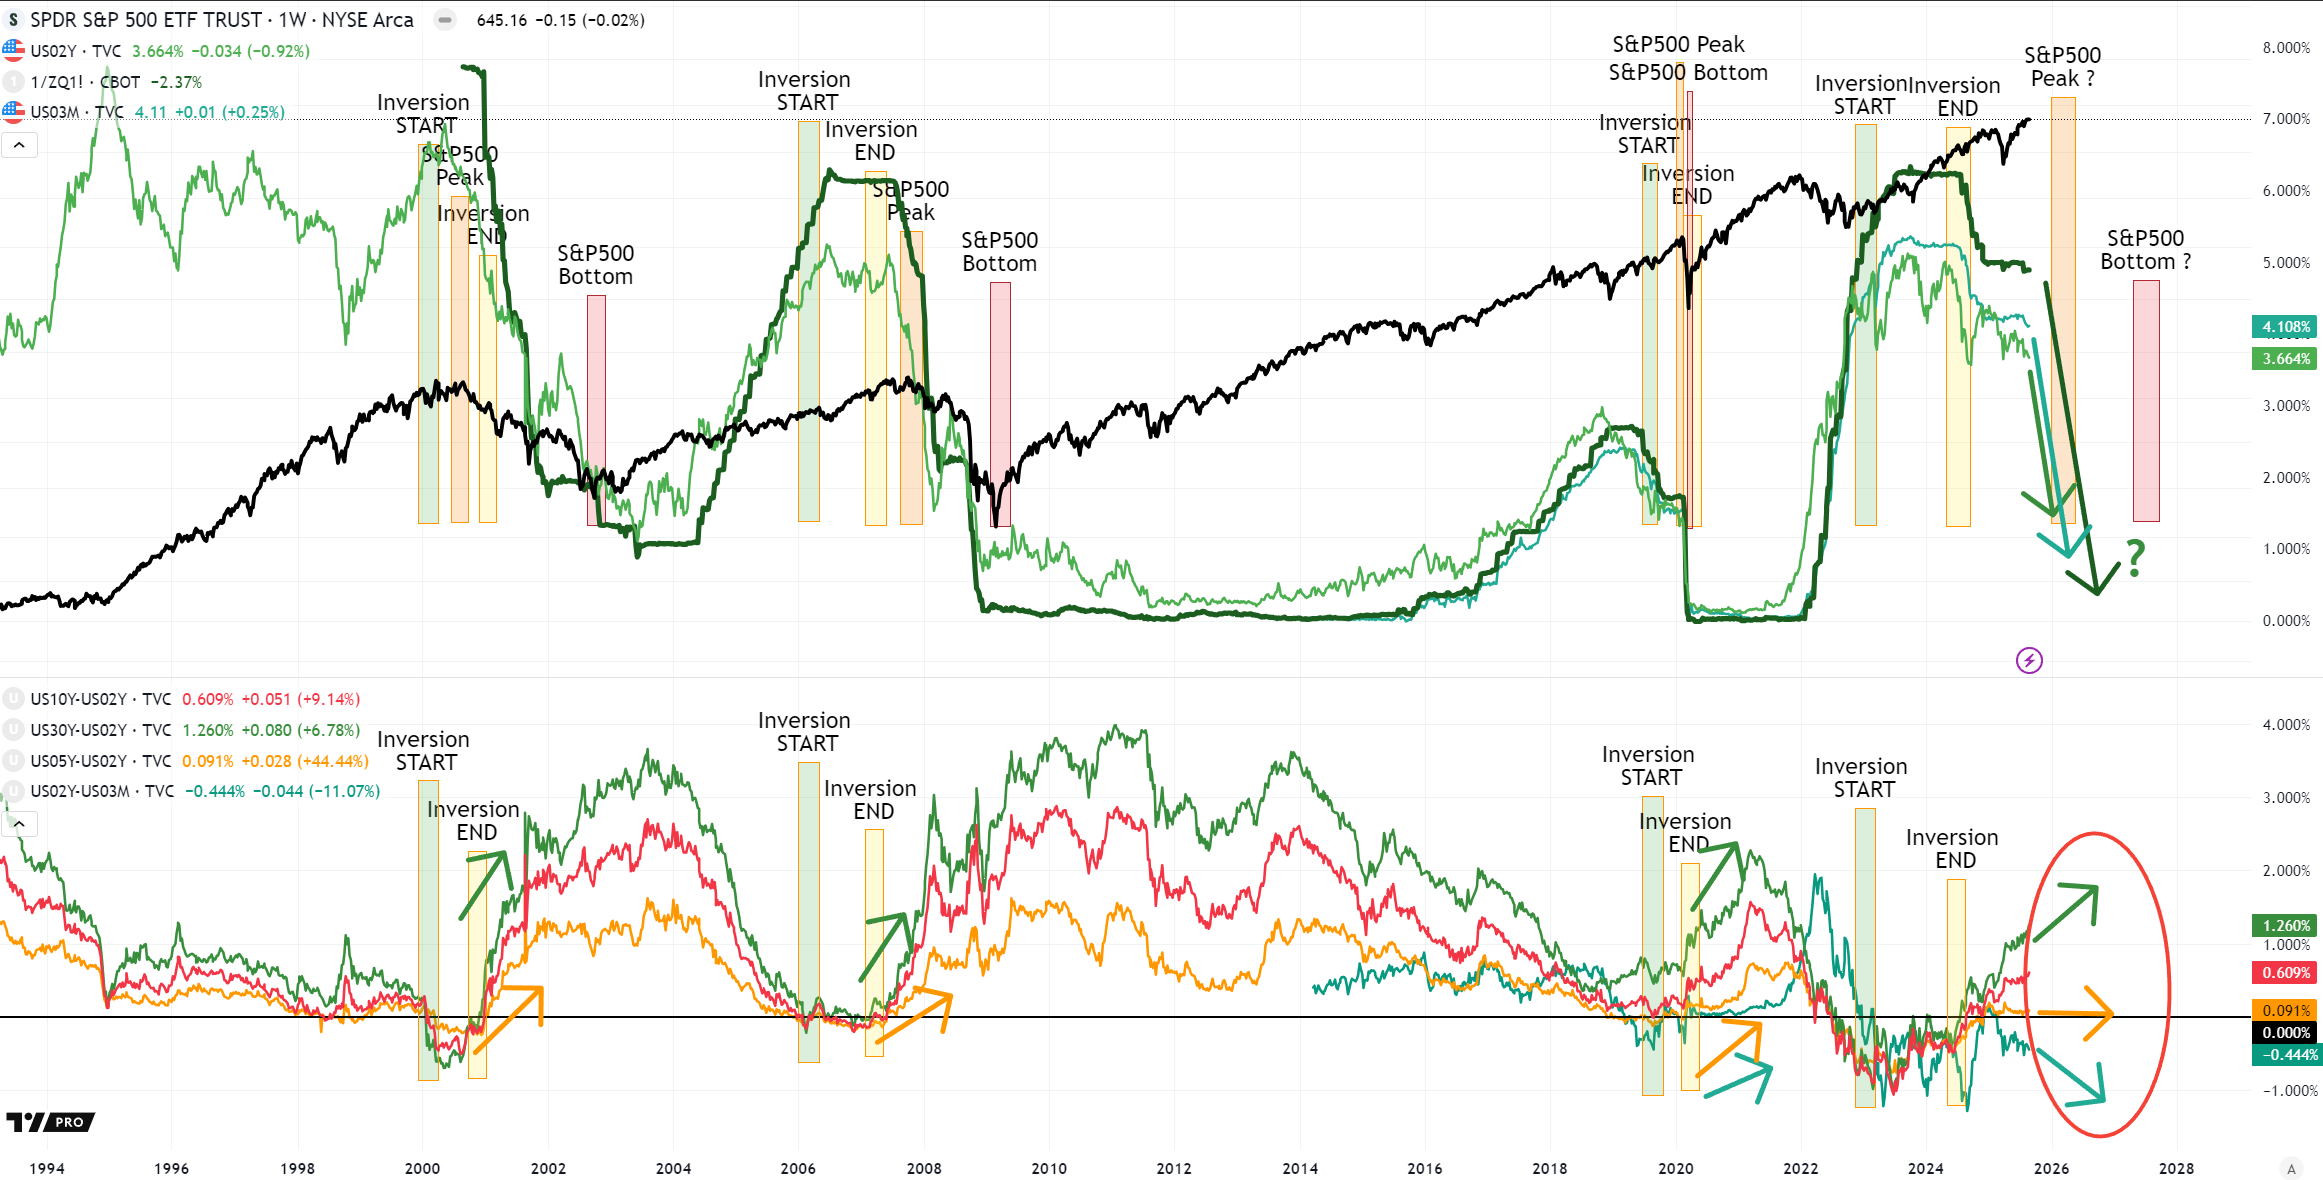
Currently we are in the steepening phase, but with a mixed setup: a bear steepener at the long end, driven by structural inflation and fiscal concerns, and a bull steepener at the front end, as markets price Fed cuts. This “barbell steepening” reflects both dynamics coexisting, depending on curve segment.
Non-parallel shifts add nuance:
- Long-term spreads (30Y–2Y and 10Y–2Y) are steepening
- Mid-term spreads (5Y–2Y) are flat
- Short-term spreads (2Y–3M) are declining and further inverting
Yield Curve Dynamics: When the Long End Steepens but the Mid Curve Stalls
There are historical precedents where long-term spreads steepened, the mid-curve stayed flat, and the very short end compressed. Such non-parallel shifts have signaled important turning points for both fixed income and equities.
Historical Parallels and Equity Market Reactions
- Mid-1990s: After Fed hikes, long-term yields rose while the 5Y stayed anchored. Equities initially struggled but entered a multi-year bull run once the front end eased.
- 2004–2006: The long end steepened on deficits and inflation concerns, while the 5Y was pinned to Fed guidance. Equities advanced on strong earnings, but imbalances foreshadowed the 2007–08 crisis.
- 2013–2014: The taper tantrum pushed long maturities higher, while the mid-curve stayed flat. Equities corrected briefly but resumed gains, with cyclicals and financials outperforming long-duration sectors.
Yield Curve Interpretation – Current Configuration
Today’s curve shows:
- A downtrend and inversion in the 2Y–3M spread
- A flat 2Y–5Y mid-curve
- A steepening at the long end (2Y–10Y and 30Y–10Y)
This pattern signals a mix of short-end caution, mid-curve stability, and long-end structural risk. Historically, such “barbell” setups tend to drive market rotations rather than broad equity sell-offs.
US GDP and Sector Outlook – August 2025
GDP and the Role of AI
The U.S. economy has been uneven in 2025: after contracting by –0.5% in Q1, growth rebounded to +3.0% in Q2. Artificial intelligence has been the standout driver, contributing about 0.5 percentage points to GDP growth. Without AI, the economy would likely have expanded by less than 1%.
Source: Business Insider
Growth Drivers
-
Artificial Intelligence & Big Tech: Tech majors are investing over $340 billion in AI infrastructure, fueling productivity and GDP growth.
Source: Barron’s -
Manufacturing: U.S. manufacturers expect +4.2% revenue growth in 2025, with stronger hiring, signaling a cyclical rebound.
Source: Reuters -
Healthcare & Professional Services: Stable contributors supported by demographics and steady demand.
Source: Investopedia
Under Pressure
-
Consumer Spending & Construction: Higher rates weigh on durable goods and housing, with households cautious on discretionary spending.
Source: Deloitte -
Trade-Exposed Industries: Tariff frictions pressure exports and disrupt supply chains.
Source: EY
Artificial intelligence has clearly become the dominant growth engine. Outside AI and industrial recovery, the economy remains fragile: consumption is slowing, construction subdued, and trade challenged. Without AI, U.S. growth would look considerably weaker, underscoring both the opportunity and concentration risk for investors.
Policy Implications — Treasury & Crypto Moves to Bypass the Fed
The administration is leaning on fiscal levers and crypto-related instruments rather than conventional monetary transmission, raising fiscal dominance risk and policy uncertainty.
1) Inflation & Policy Transmission → Tariffs and fiscal stimulus keep inflation volatility elevated while diluting Fed signaling.
2) Rates, Curve Shape & Term Premium → Investors demand more duration compensation, creating a steeper, more volatile curve. Short-term yields track Fed policy, but long-end pricing reflects uncertainty about future responses.
3) USD Dynamics → Treasury-backed stablecoins could support near-term dollar demand, but institutional credibility risks erode reserve currency status over time.
4) Treasury Market Liquidity → Strong bill demand risks collateral shortages, driving up on-the-run premiums and occasional funding squeezes.
5) Banks & Credit → Stablecoin-like instruments can disintermediate deposits, raising bank funding costs and widening credit spreads.
6) Risk Assets & Crypto → Equity risk premia rise under uncertainty; cyclicals may outperform while growth is rate-sensitive. Crypto may benefit from policy support but remains volatile to regulatory swings.
7) Legal/Institutional Overhang → Fed independence challenges raise governance risk premia.
8) International Spillovers → Trade partners may retaliate, amplifying global inflation volatility.
Market Outlook
Over the coming months, monitoring term premia, rate volatility (MOVE index), Treasury auction dynamics, and bank funding spreads will be essential to gauge systemic risk. Flows into stablecoin T-bill holdings and global capital movements will show how far alternative liquidity channels are reshaping funding. Legal and regulatory headlines around Fed governance or crypto frameworks could add further pressure.
Bottom line: With Treasury- and crypto-driven policy tools rising in prominence, the risk landscape points to persistently higher term premia (interest rates for long-term treasuries will remain high), greater inflation uncertainty, and volatile steepening episodes. Until institutional clarity improves, investors should focus on balance sheet quality, funding resilience, and careful duration management.