— date: ‘2025-08-23’ title: “Powell’s Pivot: Medium-Term Playbook for Equities — Dovish Hints, Recession Watch” tags: [Powell, Jackson Hole, Monetary Policy, Neutral Rate, Recession, Stagflation, Equities, Style Factors, Sectors, USD]
S&P 500 Indicator
The Indicator value has increased considerably since last week, though with elevated uncertainty. This uncertainty should diminish as fresh data arrives next week.
We have not yet reached extreme Indicator readings, leaving room for further upside. From a chart-technical perspective, Powell’s Jackson Hole speech propelled markets back above the daily MA-20 — but directly into the 6500 Sell-Zone. The apparent weakness of the last four weeks vanished in a single session. Too good to be true?
Topping-Market At first glance, a weekly topping phase may appear to contradict the bullish uptrend reflected in the daily S&P 500 Indicator. The most recent market peak unfolded between December 2024 and February 2025. It took 11 full weeks before equities finally entered a sharp decline, triggered by Donald Trump’s announcement of new tariffs. Historically, the longer a top-formation develops, the more severe the subsequent downturn tends to be. Early warning signs have always preceded major crashes, yet the specific signals vary each time. History does not repeat itself, but it often rhymes.
Jackson Hole – Executive Summary
Chair Powell’s Jackson Hole remarks nudged policy guidance in a more dovish direction while reaffirming the Fed’s commitment to 2% inflation and a data-dependent path.
The speech matters not just for days, but for months and quarters ahead:
- It suggests a slower, more measured easing cycle.
- It raises the possibility of a higher neutral rate (r*).
- It reflects a Fed more attentive to labor-market weakening.
That combination supports valuation stability for quality growth but keeps recession risk firmly on the radar.
Monetary Policy and the Fed’s Framework Review
Medium- to Long-Term Equity Implications
1) Rates, Term Premium & Valuations
-
Powell opened the door to rate cuts, but emphasized that policy remains restrictive and firmly data-driven. This points to shallow, gradual easing rather than a rapid pivot — typically a backdrop favoring quality growth and profitability leaders over high-beta speculation.
Powell signals openness to cuts -
The neutral rate (r*) — the real interest rate consistent with stable inflation and full employment — may now be structurally higher than in the 2010s. Back then, r* was near zero, enabling the Fed to keep rates ultra-low without stoking inflation. This underpinned a decade of cheap money, falling discount rates, and multiple expansion.
Powell now suggests long-term forces — stronger labor supply, higher productivity, persistent fiscal deficits, and geopolitical frictions — are pushing r* upward.
Framework and longer-run goals discussion
- For equities, a higher r* implies a higher floor for discount rates, limiting valuation re-rating. Companies reliant on long-dated cash flows (unprofitable growth, high-multiple tech) face a tougher hurdle, while firms with strong near-term cash generation, pricing power, and resilient margins should fare better.
In practical terms: the 2010s “easy money” playbook is gone. Multiples are less likely to expand simply on lower rates; sustainable earnings power is now the key driver.
2) Earnings, Margins & Capex
With policy restrictive and demand cooling, top-line growth slows while unit labor costs gain importance. Markets will reward margin discipline, pricing power, and strong balance sheets, while punishing unprofitable growth.
Markets cheered but caution lingers
3) Style & Factor Tilt
- Quality, cash-generative growth over speculative growth.
- Large caps with balance-sheet resilience over levered small-cap beta (after the initial “cheaper money” pop).
- If cuts reflect weaker growth, defensives (Staples, Health Care, Utilities) tend to outperform — a trend that already appears underway, signaling the late-cycle phase for both economy and equities.
Cycle sensitivities overview
4) Sector Takeaways & Rotation Dynamics
Financials: Lower rates ease funding costs, but weaker growth pressures credit quality. Banks benefit from short-term relief, but if the yield curve flattens and defaults rise, earnings resilience fades. Insurance companies, with longer liability duration, may be better positioned under a higher r* regime.
Tech/Comm & Long-Duration Assets:
- Big Tech (cash-rich, global platforms with durable moats) can weather higher discount rates and sustain a premium.
- Small-cap tech (unprofitable or early-stage firms) remains highly vulnerable, as their long-dated cash flows are discounted more harshly.
Industrials / Materials / Energy: Highly cyclical and tied to real-economy momentum. Vulnerable if growth slows while input costs (tariffs, energy) remain sticky. Fiscal spending or reshoring could help at the margin, but stagflation risk looms.
Tariff-related price pressures noted
Sector Rotation — Current Signals:
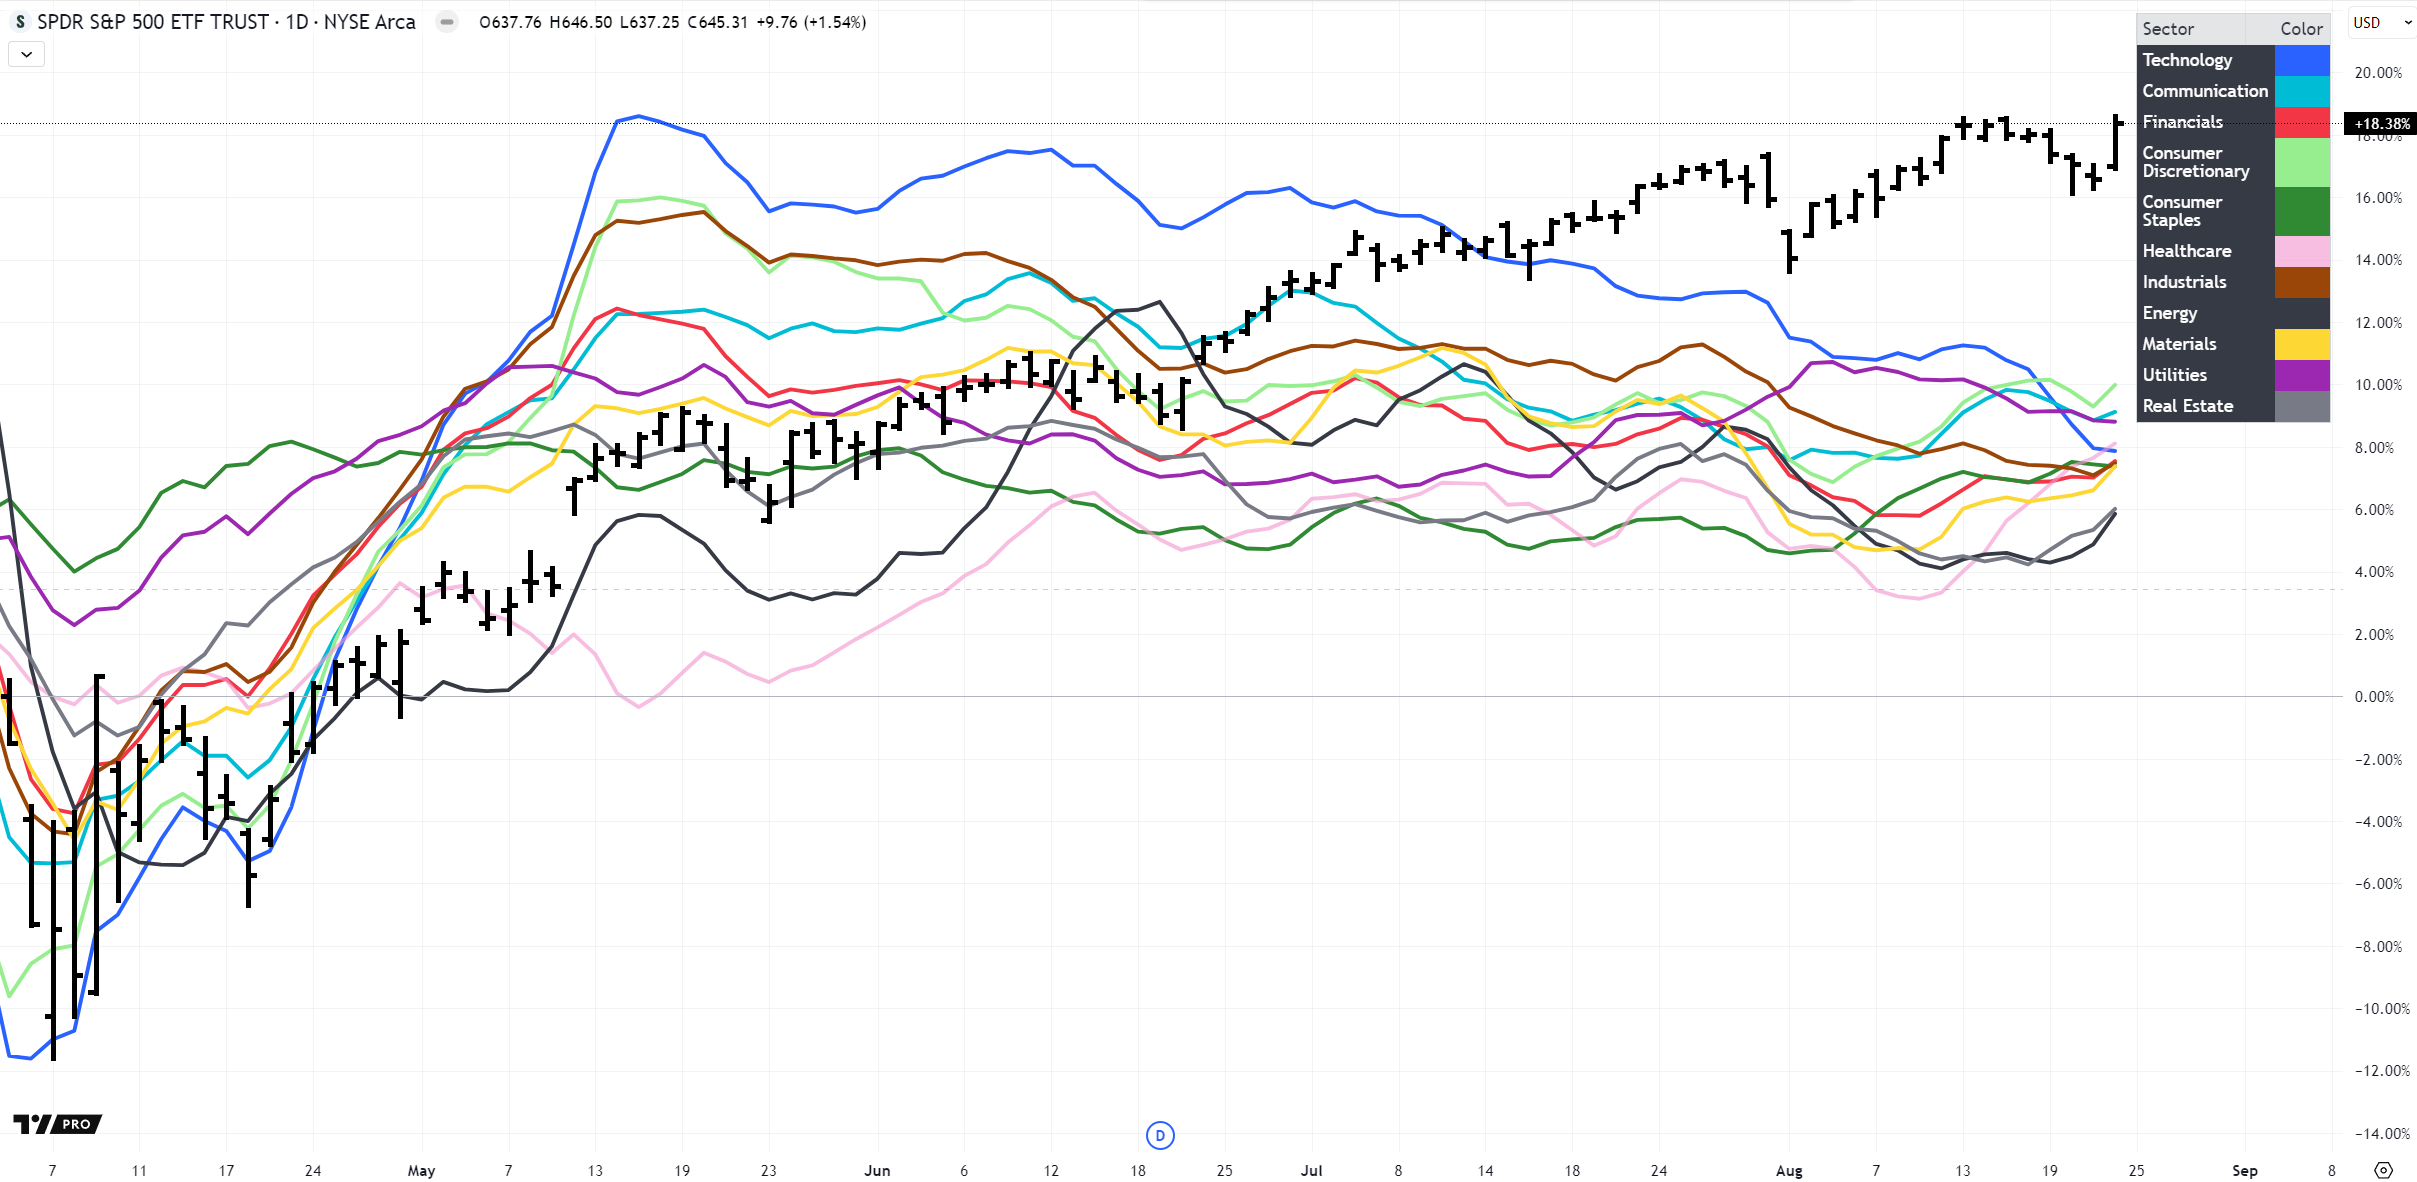
- Healthcare leads over Real Estate and Energy — late-cycle preference for predictable earnings streams.
- Defensives outperforming Tech is atypical in bull runs and signals caution: the rally leans more on policy hope than sustainable earnings.
- Parallels with crypto/altcoins and small-cap equities (Russell 2000): both are speculative beta plays that typically rally late in the cycle. This suggests the current move may represent a final leg up rather than a new bull market.
Tariff pressures reinforce this rotation, weighing on cyclicals while boosting defensives and quality growth.
📌 Implication for investors: Current rotation aligns with late-cycle playbook — Big Tech and Defensives lead, while speculative small-cap tech and Russell 2000 remain vulnerable if recession risks materialize.
5) USD, Liquidity & Global Risk
- A measured Fed easing path argues for a range-bound USD, limiting FX tailwinds for U.S. multinationals and EM risk assets.
- Liquidity improves at the margin but remains data-dependent.
Policy path remains data-dependent
Recession Watch — Powell’s Flags
1) Labor-Market Fragility
Powell described a “curious balance”: supply and demand cooling together. Such symmetry can break abruptly, risking faster unemployment spikes and weaker consumption.
2) Hiring Downshift
Payroll growth has slowed to 35k/month (past three months) vs 168k in 2024 — a classic late-cycle deceleration that often precedes earnings downgrades.
3) Real Growth Loss of Momentum
Real GDP growth at 1.2% in H1 2025 is roughly half last year’s pace — consistent with late-cycle dynamics.
4) Stagflation Risk via Tariffs
Tariff-driven inflation remains a risk: slower growth + sticky prices = stagflation, which compresses both multiples and margins.
5) Market & Economist Warnings
Markets rallied on Powell’s dovish tilt, but institutional commentary points to recession risk into late-2025/early-2026 if tariffs, weaker hiring, and tighter conditions compound.
Portfolio Playbook (Multi-Quarter Horizon)
- Lean Quality: Prioritize companies with high FCF, strong balance sheets, durable pricing power, and secular growth.
- Barbell Growth & Defensives: Balance exposure between quality growth and defensive sectors for resilience.
- Watch Credit & Small Caps: Relief rallies fade quickly if credit spreads widen. Be selective in small caps — focus on profitability and cash coverage.
- Risk Controls: Shorten earnings beta, favor quality within cyclicals, and maintain optionality for a downside macro scenario.
What Could Invalidate This View?
- Rapid disinflation without growth damage → faster cuts and lower real rates → multiple expansion.
- Productivity renaissance → lifts trend growth, offsets higher r*.
- Tariff relief → reduces input-cost stickiness, improves margins.
Key Data to Watch (Next 4–8 Weeks)
- Labor: payrolls, unemployment rate, hours worked, jobless claims.
- Inflation: core PCE/CPI vs sticky services inflation.
- Activity: ISM new orders, real retail sales, housing turns.
- Financial Conditions: HY spreads, bank lending surveys, term premium.