Market Signals – S&P 500 Indicator The daily S&P 500 Indicator has weakened further and is now flashing a Distribution Day. This aligns with the weekly signal, which had already detected a Long-Term Distribution, reinforcing the risk of further downside. The first key support—the daily 20-day moving average (MA20)—was heavily whipsawed in yesterday’s trading. While the S&P 500 (ES) managed to close above this level, the Nasdaq (NQ) slipped below despite a long lower wick, suggesting some demand but also vulnerability.
Sector Rotation
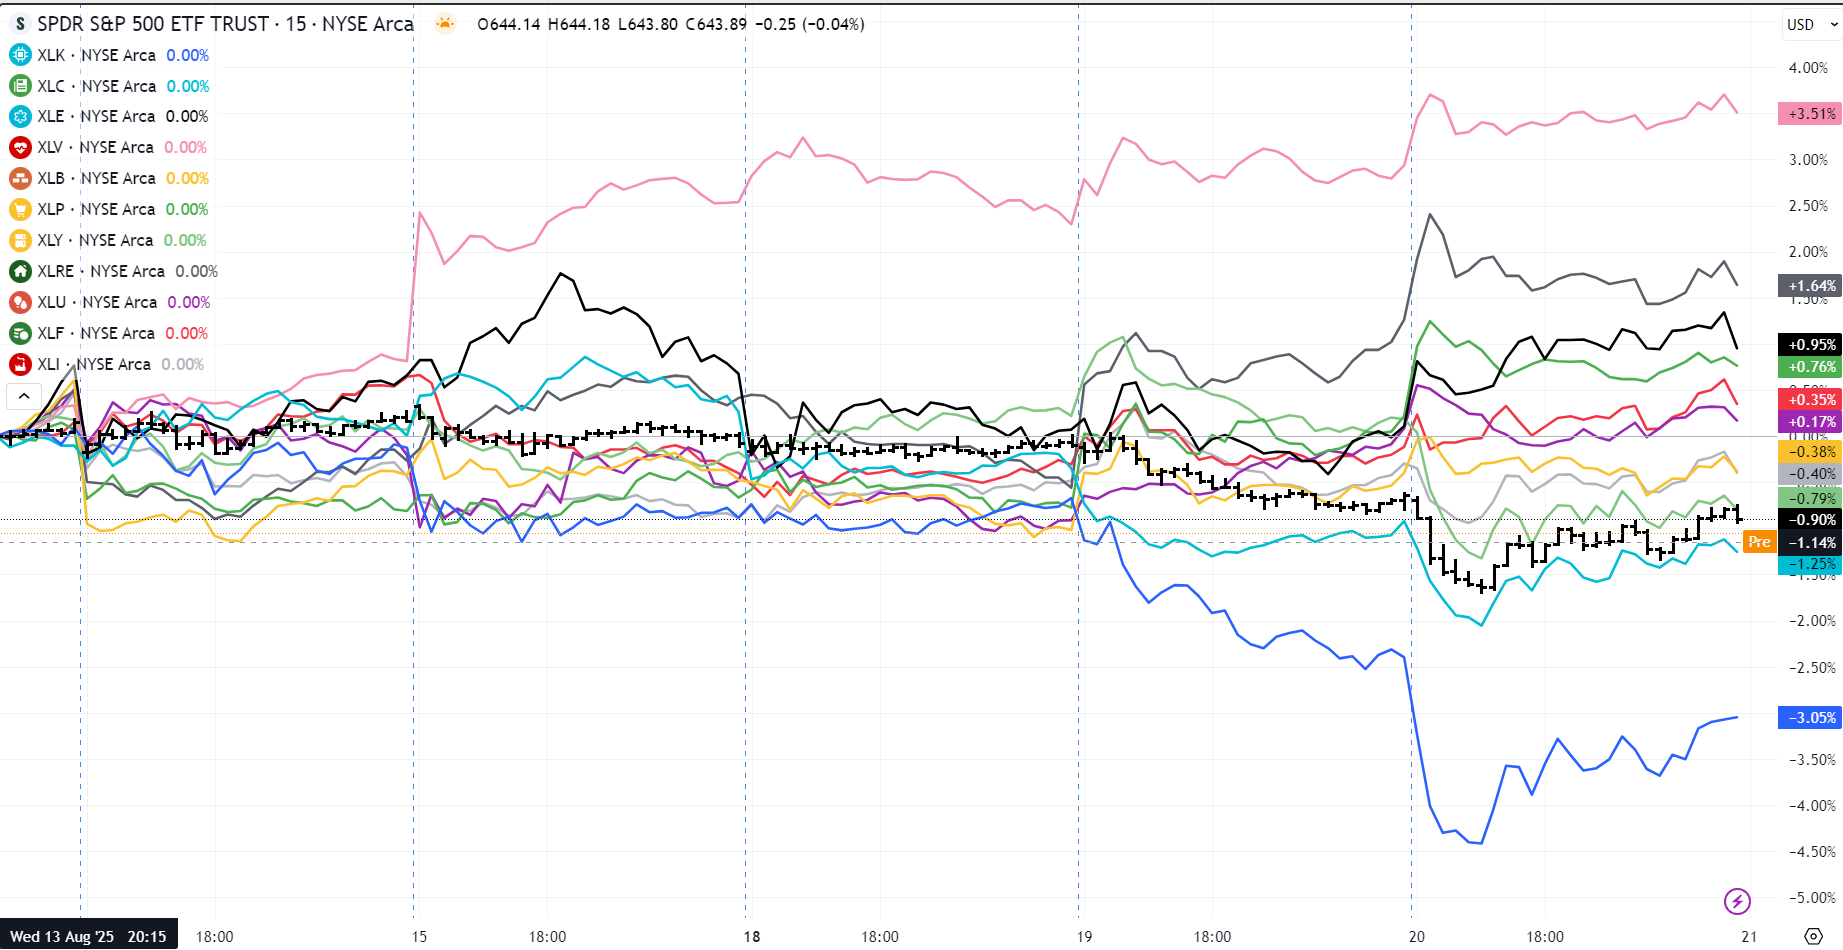
Large-cap tech stocks were once again the worst performers, followed by Consumer Discretionary. In contrast, defensive sectors outperformed, with Healthcare leading and Real Estate showing resilience. Anticipation of future Fed rate cuts may support Real Estate, as lower yields would indirectly ease mortgage rates—but the question remains: is this truly the main driver of housing costs?
Ranked Housing Cost Drivers (by Impact)
1. Supply–Demand Imbalance
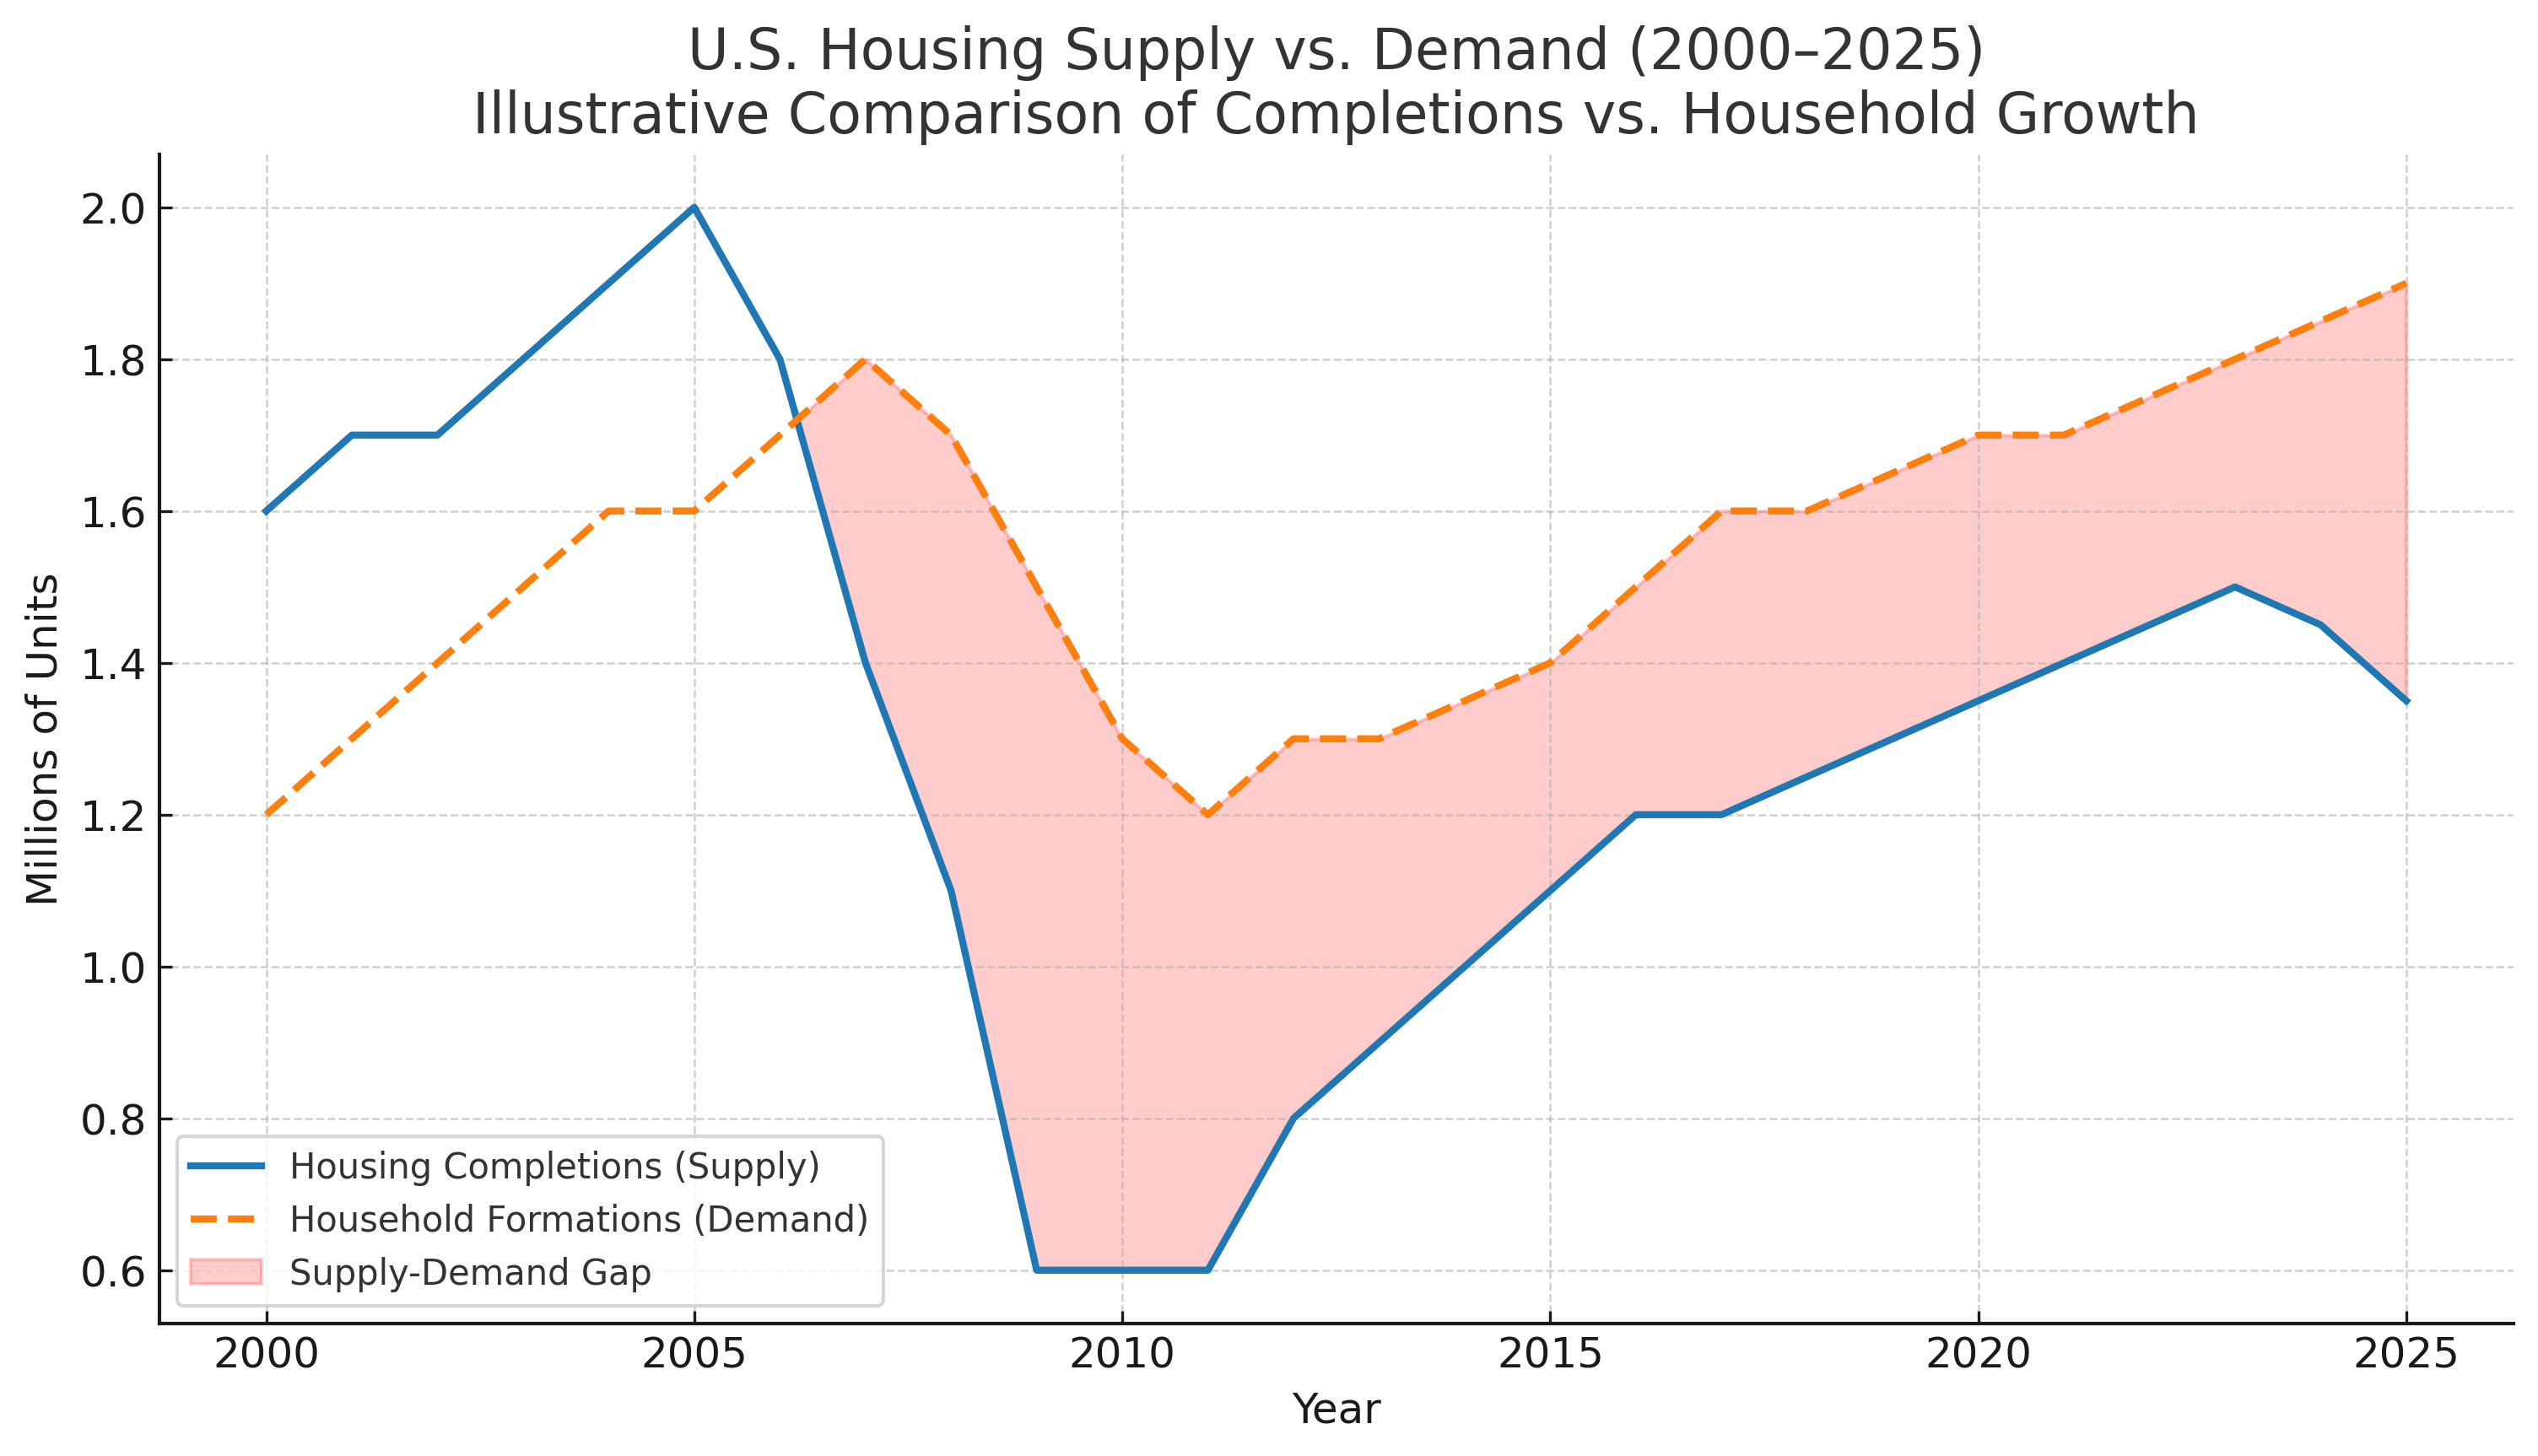
Shortage of approx. 4–5 million homes due to underbuilding and regulation since 2008
Persistent upward pressure on prices due to cost inflation, and labor shortages. (7% gap between demand growth and supply)
-
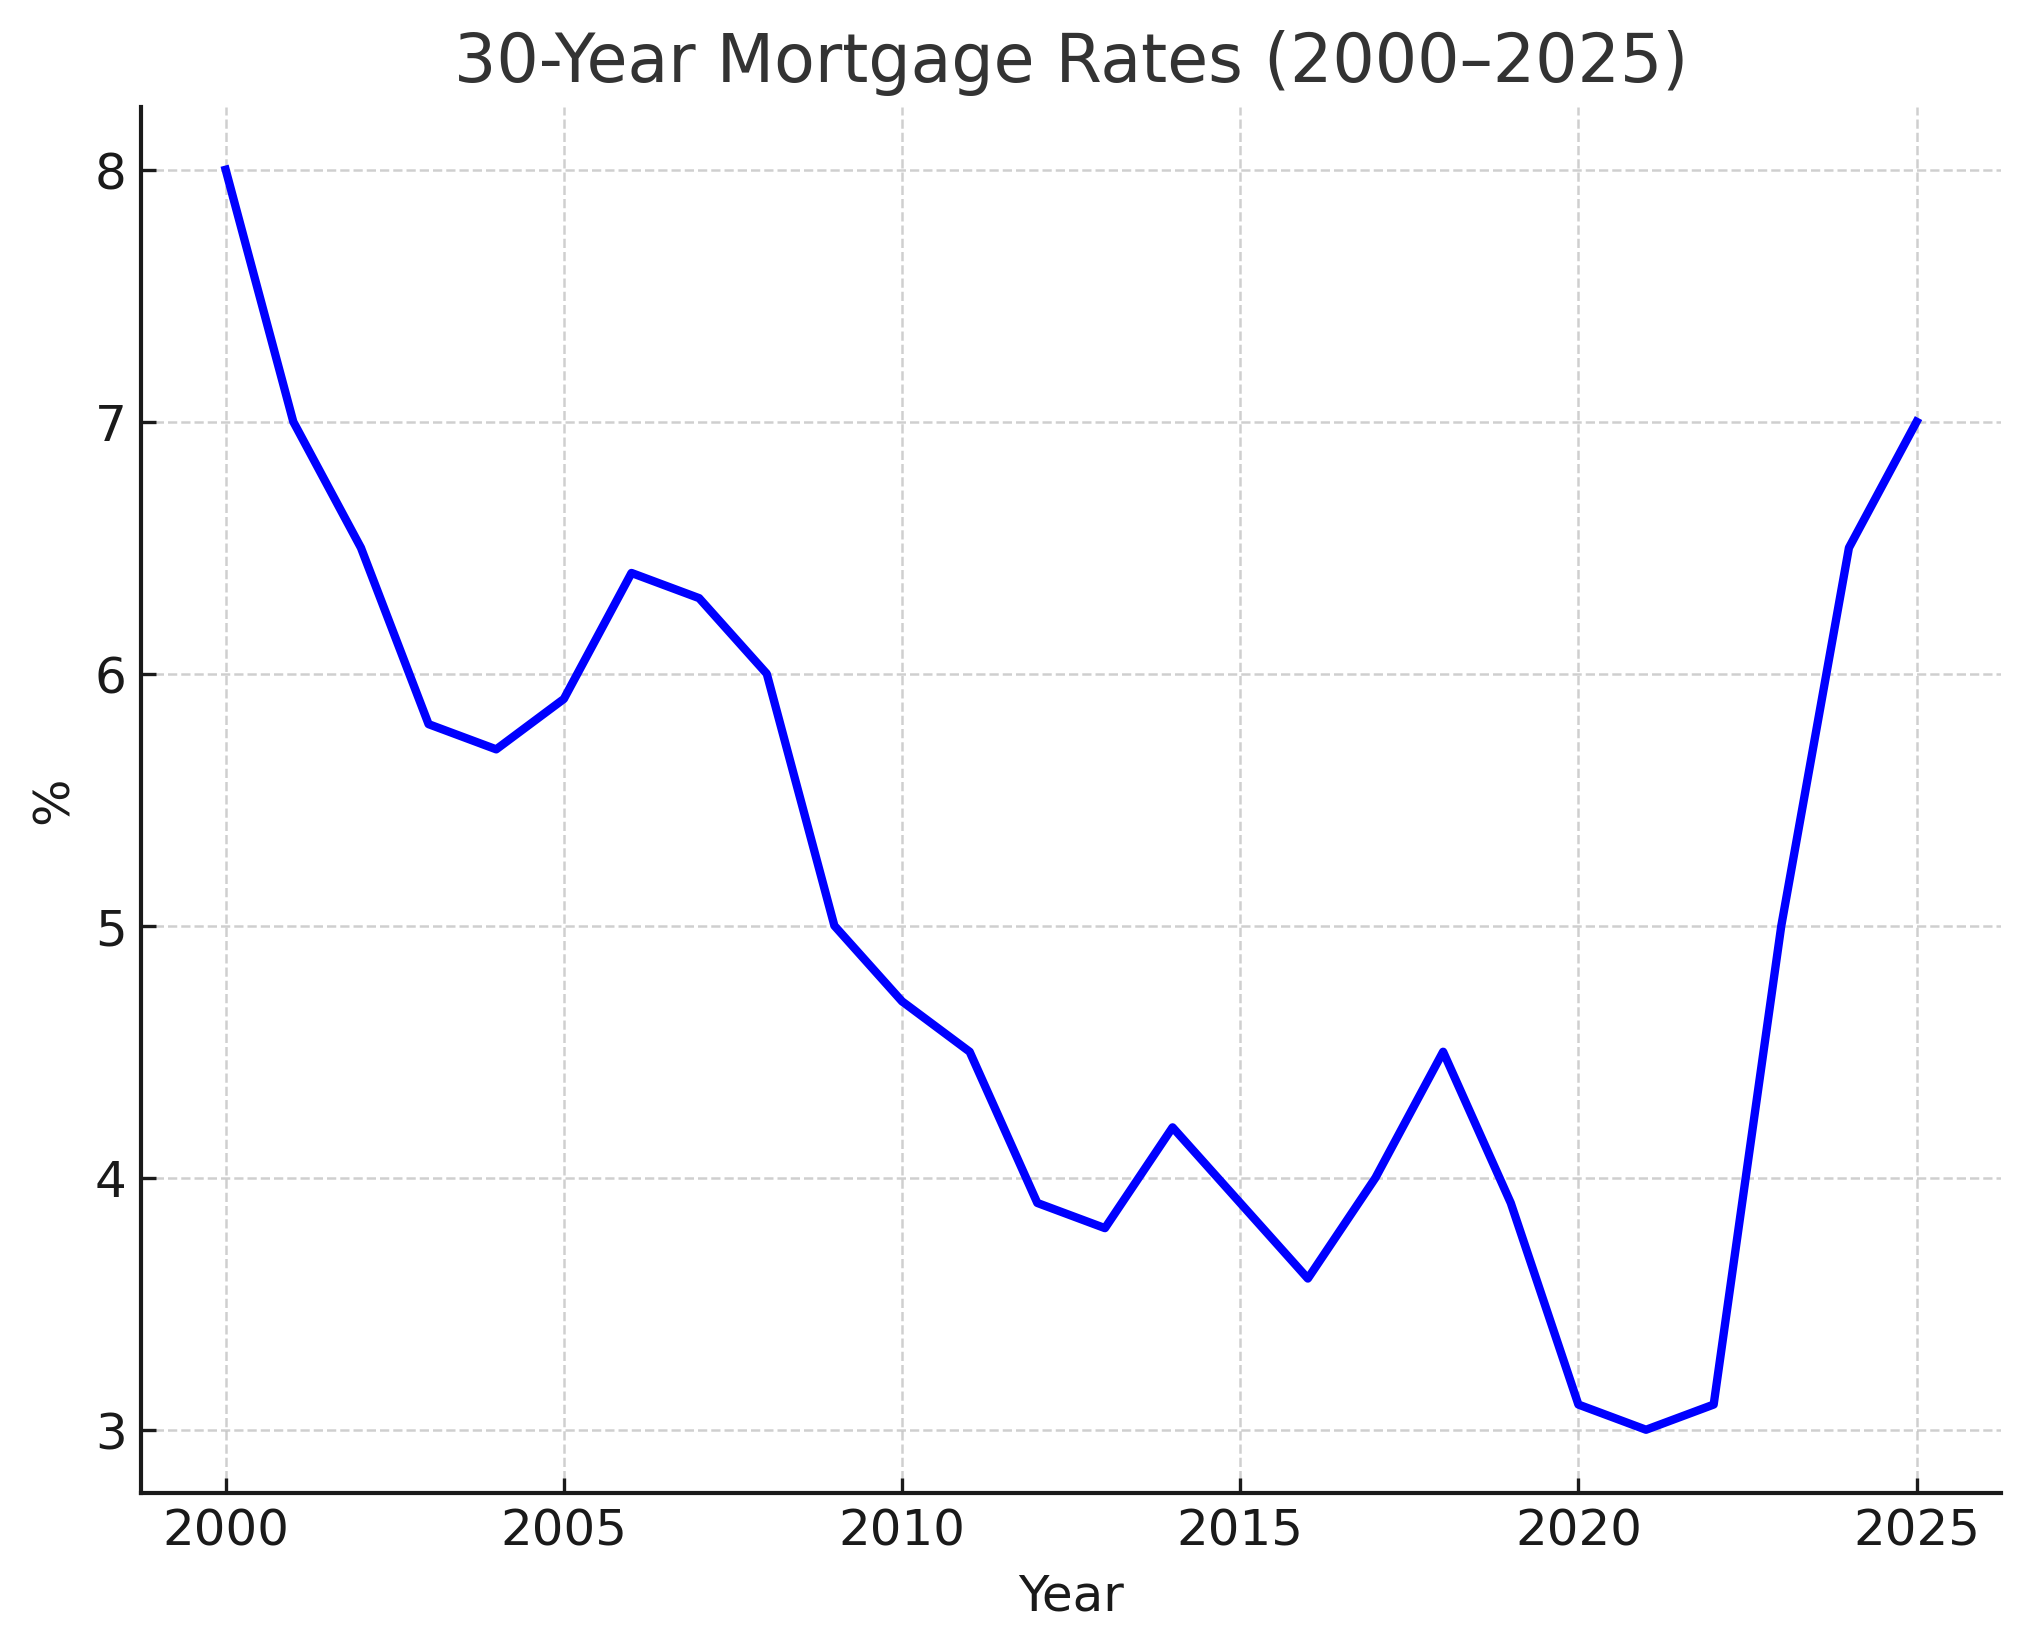
Interest Rates Each 1% change in mortgage rates shifts home prices by approx. 10–16%. Current rates (approx.6–7.5%) are a key affordability barrier. When the Fed cuts its policy rate, banks’ short-term funding costs decline, which typically pushes down Treasury yields—especially the 10-year yield that anchors U.S. mortgage pricing. Since mortgage rates are closely tied to yields on mortgage-backed securities, lower Treasury yields translate into lower mortgage rates. The effect is not one-to-one: a 0.25% Fed cut might only reduce mortgage rates by about 0.10–0.20 percentage points, and broader factors like inflation expectations, investor demand for bonds, and credit risk premiums can either amplify or offset the move.
-
Regulation & Zoning Regulatory burdens, zoning restrictions, and permitting delays can add 20–25% to housing costs, especially in high-demand metros such as California and New York. Development fees, building codes, and NIMBY resistance further amplify costs.
-
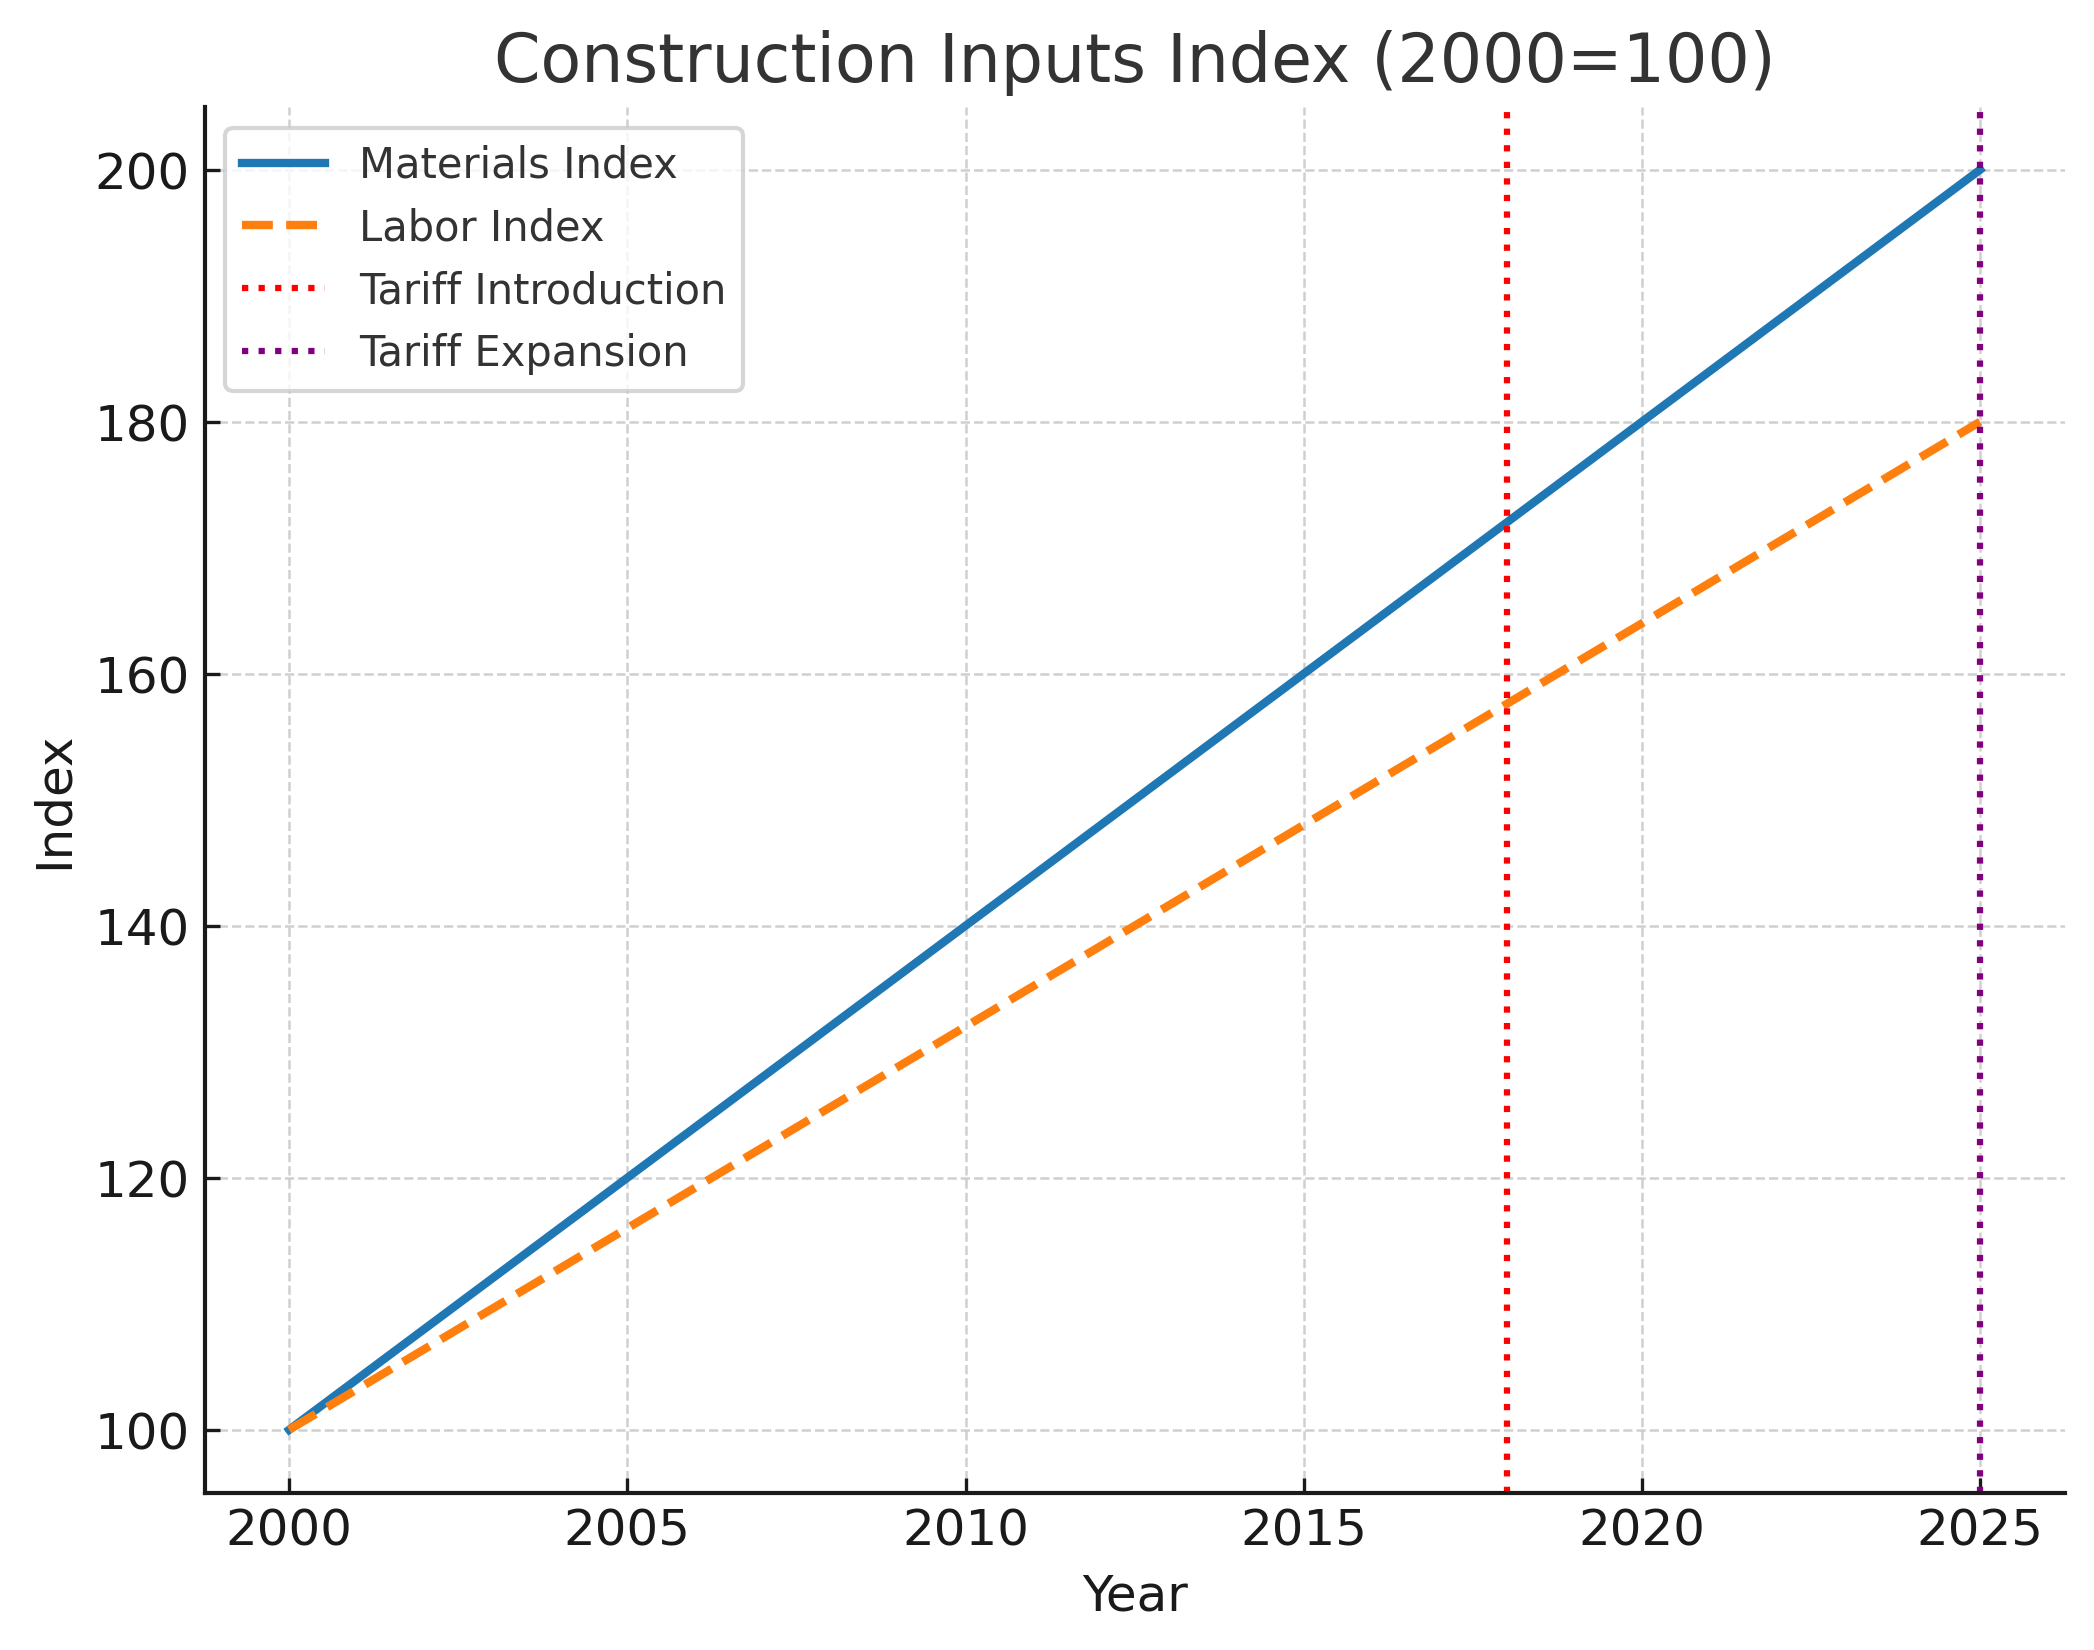
Construction Inputs Materials (31%) + labor (26%) = 57% of approx. construction costs. Tariffs and wage shortages push these higher. The U.S. housing labor shortage stems from workers leaving after the 2008 crash, an aging workforce nearing retirement, reduced vocational training programs, and tighter immigration flows that once supplied much of the construction labor. Trump-era immigration policies, which restricted both legal and undocumented labor inflows from Latin America, worsened the shortage by cutting off a critical source of skilled and semi-skilled workers. Combined with competition from other industries offering steadier or higher-paying jobs, these factors have left the sector short by an estimated 400,000–500,000 workers, pushing up wages, slowing project timelines, and adding significantly to housing costs.
-
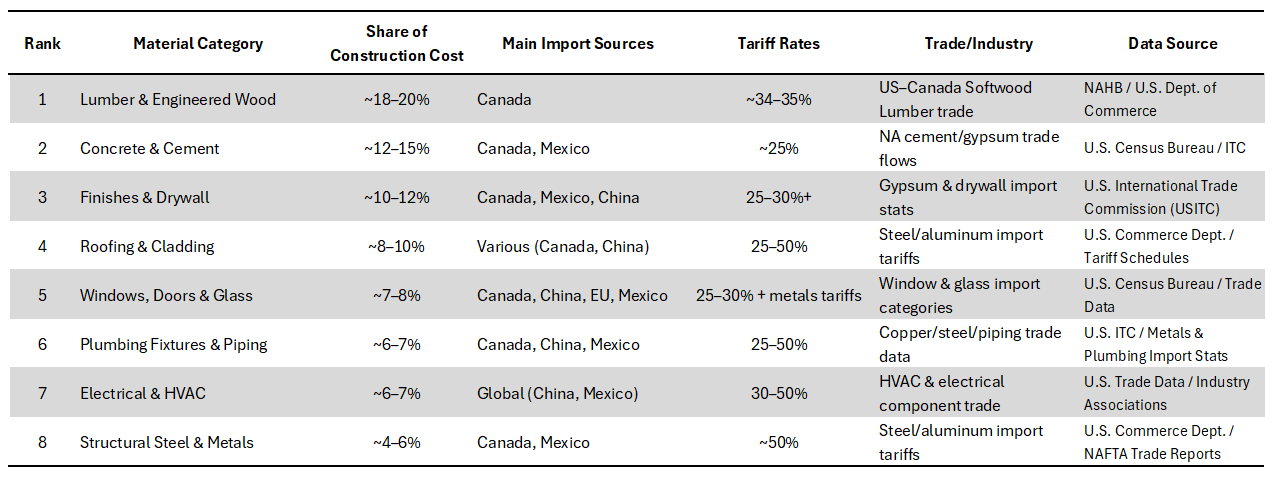
Tariffs & Material Shocks Tariffs on lumber, steel, and other inputs add 5–10% to construction costs, or $10,000–11,000 per home.
-
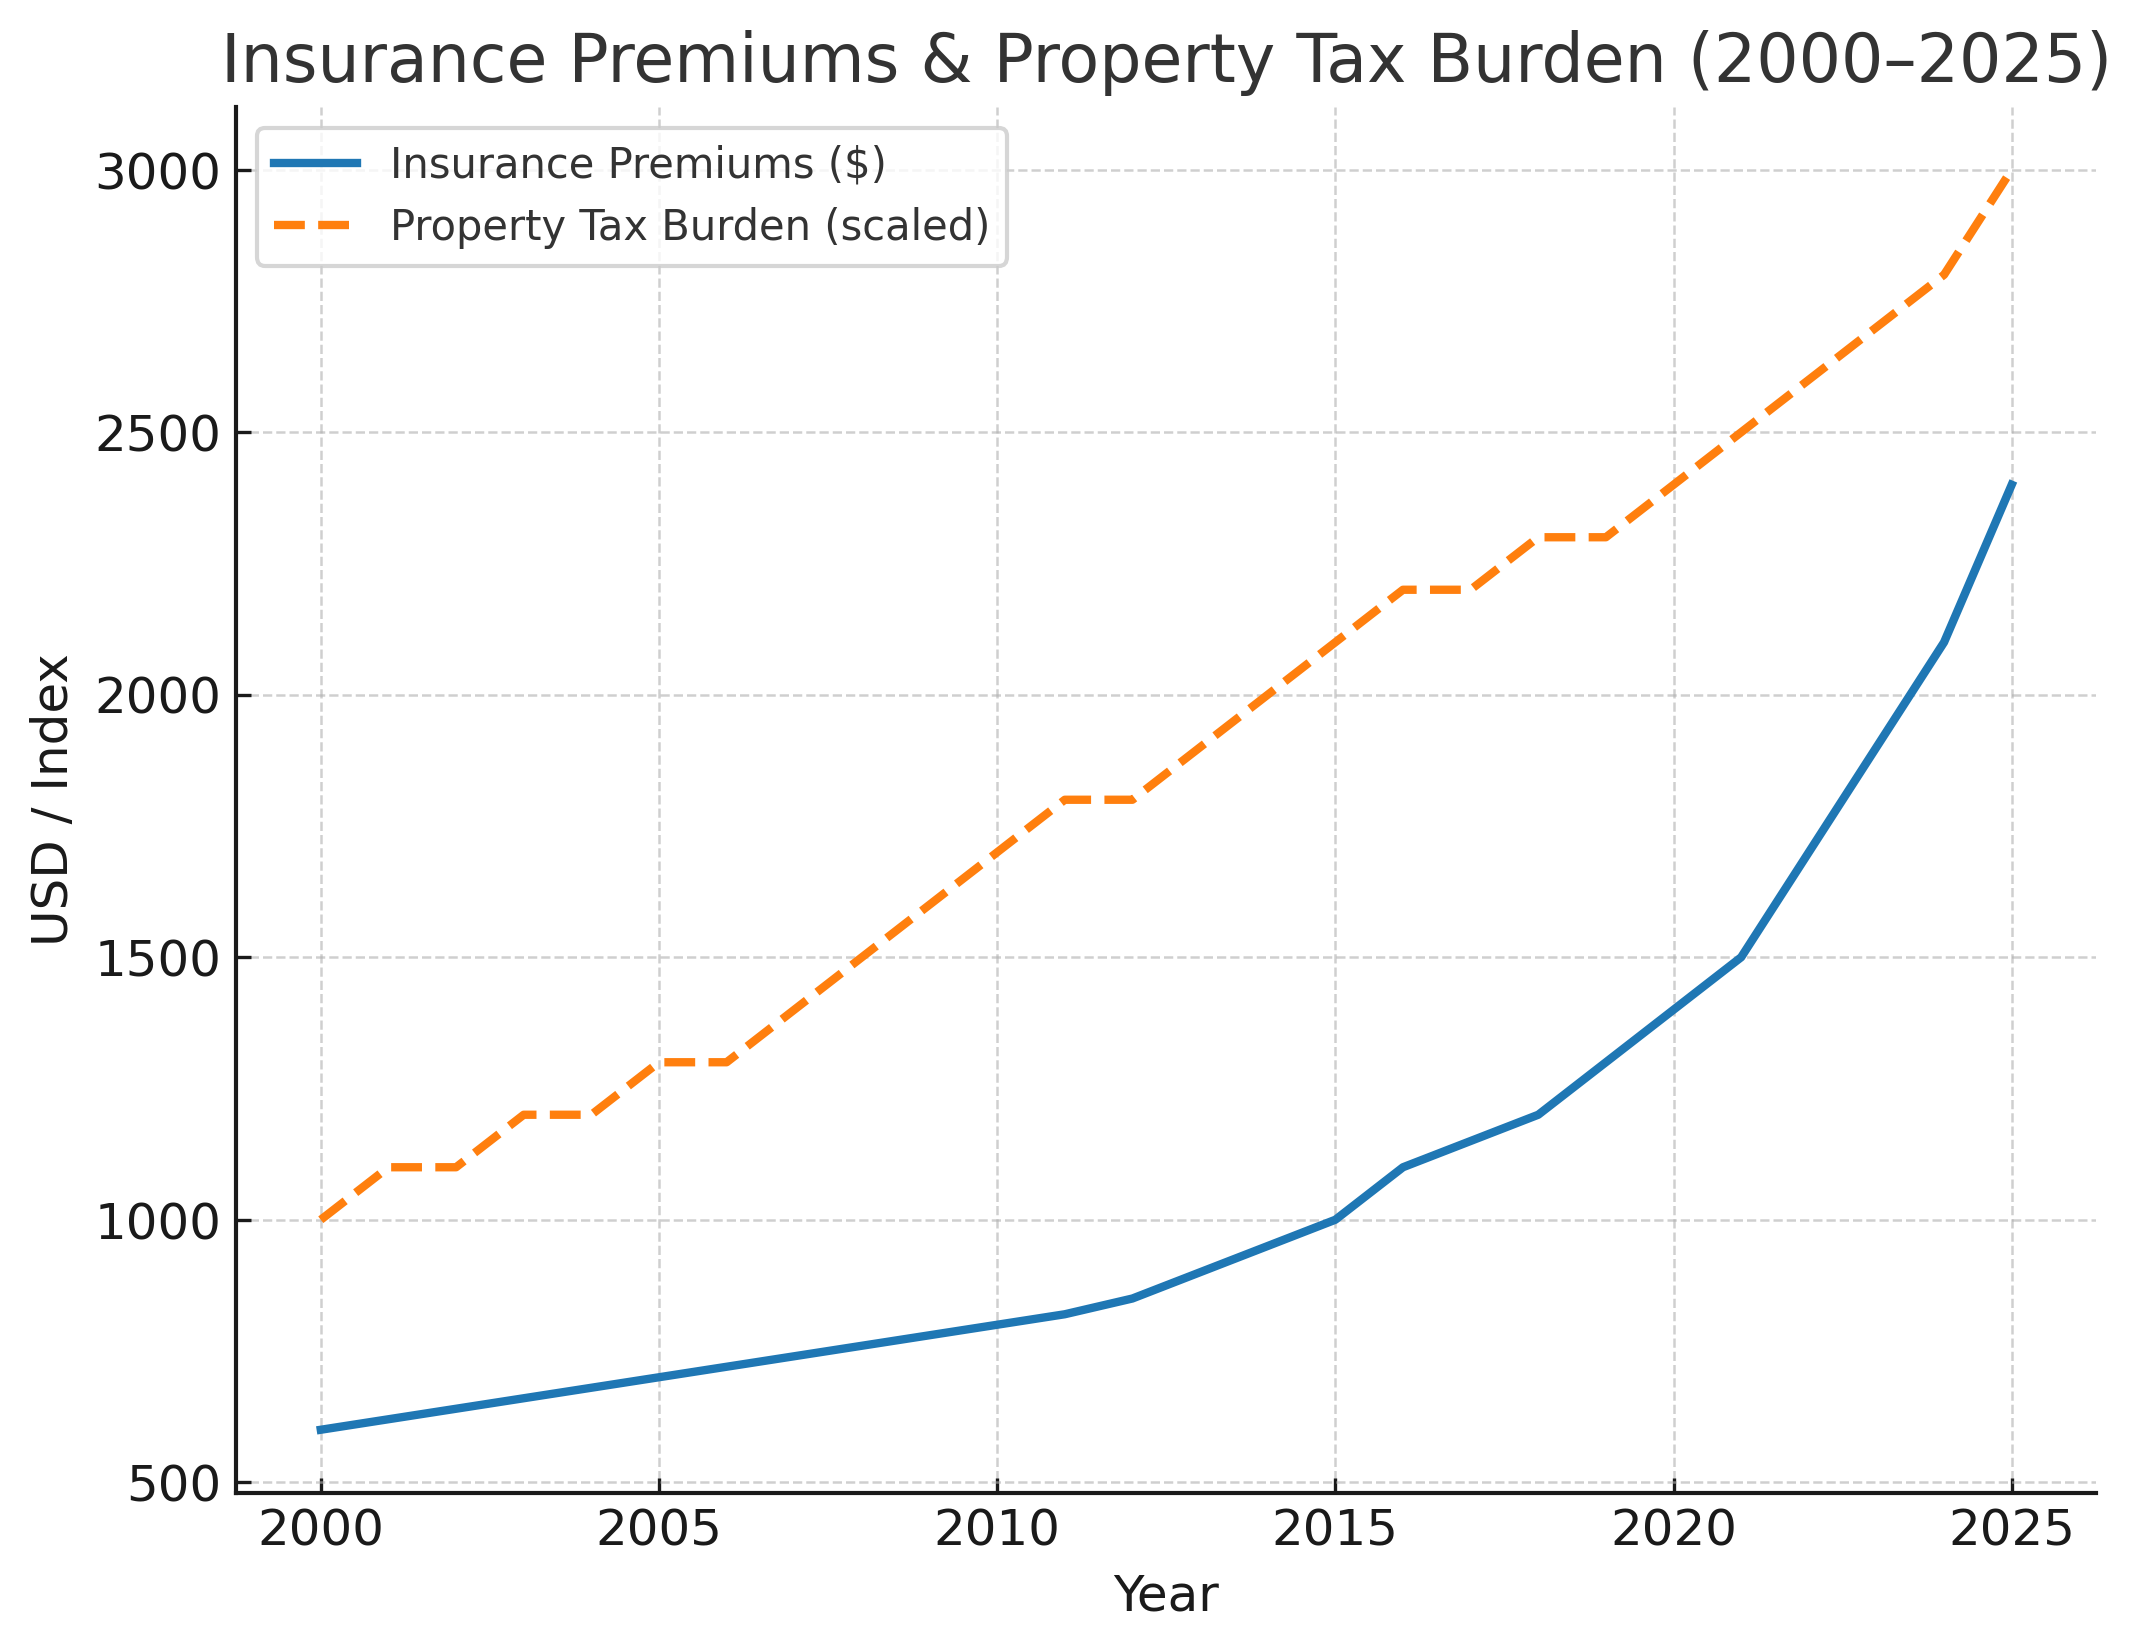
Insurance & Risk Costs Rising premiums in wildfire, hurricane, and flood zones—harder to quantify, but increasingly material. Homeowners’ insurance costs are rising sharply across the U.S., with average premiums up 11% in 2024–25 and climate-exposed states like Florida, California, Louisiana, Colorado, and Texas facing 30–50% hikes. Wildfire and flood risks have led some insurers to withdraw entirely from high-risk markets, forcing remaining providers to charge steeply higher rates. For many households this adds several hundred to over $1,000 a month to carrying costs, making homes unaffordable; and since lenders require coverage, unaffordable or unavailable insurance can further depress local housing markets.
-
Carrying Costs (Taxes, Utilities, Maintenance) Combined burden at historic highs relative to income; not easily broken down but a major drag on affordability. Carrying costs for U.S. homeowners have reached historic highs, with property taxes averaging 1.1% of home value annually—and as much as 2–2.5% in high-tax states—while rising energy bills can consume 10–20% of lower-income households’ monthly income. On top of this, maintenance typically runs 1–3% of a home’s value each year, or $4,000–12,000 for a $400,000 property. When combined with mortgage payments and insurance, these expenses push roughly 30% of homeowners into being cost-burdened, the highest share relative to income since the early 1980s.
Key Takeaway on Housing Costs: High housing costs are not simply the Fed’s fault. Structural underbuilding, restrictive regulation, tariffs on materials, and labor shortages tied to immigration policy have been the true cost drivers. Blaming monetary policy alone misses the broader picture!
Market Outlook: - Federal Reserve / Jackson Hole (Friday): Powell’s speech could drive the S&P +2% relief rally if dovish, or a -3% correction if hawkish. - Retail Earnings (Walmart, Target, Lowe’s, Home Depot, TJX, Estee Lauder): Resilient consumer spending could lift the S&P +0.5%–1%, weak guidance could drag -0.5%–1%. - Tech Sector Focus (Nvidia, AI sentiment): Nvidia earnings preview may swing the market +1% to -2%. - Macro Data: Jobless claims, housing reports, and inflation revisions may nudge markets by ±0.3–0.5%. - The S&P 500 Indicator underscores caution. Smart money is rotating out of risk assets, and the Distribution Day aligns with typical late August seasonality, often marked by pullbacks or sideways chop, suggested also by the typical late August seasonal weakness.