ETF Flow Analysis
Monitor fund flows, AUM changes, and trading activity across asset classes, sectors, and themes. ETF flows offer predictive signals: The creation/redemption mechanism typically introduces a 1-2 day lag between large trades and their full market impact, potentially providing early insights into upcoming price movements.
Last Update: --
🗂️ Sector & Asset Class Flow Overview
Cumulative fund flows per sector and per aggregated asset class. 6M is the full history the file carries (~6 months of trading days). Cell shading is scaled within each column, so the 1-day column stays readable next to the much larger rolling sums. Click a header to sort.
| Sector / Asset Class | 1 Day Flow | 20D Rolling Flow | 6M Rolling Flow |
|---|---|---|---|
| Loading flows… | |||
ETF Flow Summary
⚠️ Flow Anomalies 0
ETFs with unusual fund flow activity (significant inflows/outflows relative to AUM). Click ticker or use ↑↓ keys to view chart.
| Ticker | Name | Class | AUM | Flow (Est.) | Flow/AUM | Signal |
|---|---|---|---|---|---|---|
| Loading anomalies... | ||||||
🏭 Sector Fund Flows
Click a bar to view historical flows
📊 Fund Flows by Asset Class
Click a bar to view historical flows
📈 Historical Fund Flows
Click on the bars in the charts or on the tickers in the table to track historical flows. Note: Not all ETFs have flow data available.
📈 ETF Price Chart
Analyze price action alongside fund flows
ETF Volume Summary
📊 Unusual ETF Volume Activity 0
ETFs with trading volume significantly above their 7-day average. Click ticker or use ↑↓ keys to view chart.
| Ticker | Name | Category | Volume | MA7 | Ratio | % Change | Date |
|---|---|---|---|---|---|---|---|
| Loading unusual volume data... | |||||||
All ETF Flows
Loading ETF data...
Understanding ETF Metrics
- AUM (Assets Under Management)
-
The total market value of all assets held by the ETF.
AUM = Shares Outstanding × NAVHigher AUM generally indicates greater liquidity and lower trading costs. - NAV (Net Asset Value)
-
The per-share value of the ETF's underlying holdings. NAV is calculated at end of each trading day:
NAV = (Total Assets - Liabilities) / Shares OutstandingETF market prices typically trade very close to NAV. - Shares Outstanding (SO)
- The total number of ETF shares currently in existence. Unlike stocks, ETF shares can be created or redeemed daily through the creation/redemption mechanism, making this number variable.
- Flow (Estimated)
-
Net money moving into or out of the ETF.
Flow = AUM(t) - AUM(t-1) × (NAV(t) / NAV(t-1))This formula removes the price change effect to show actual new investment. Positive flow = net inflows (buying), negative flow = net outflows (redemptions). - Volume Ratio
- Today's trading volume divided by the average daily volume. A ratio above 1.5x suggests unusual trading activity and potentially significant fund flows or investor interest.
The Creation/Redemption Mechanism
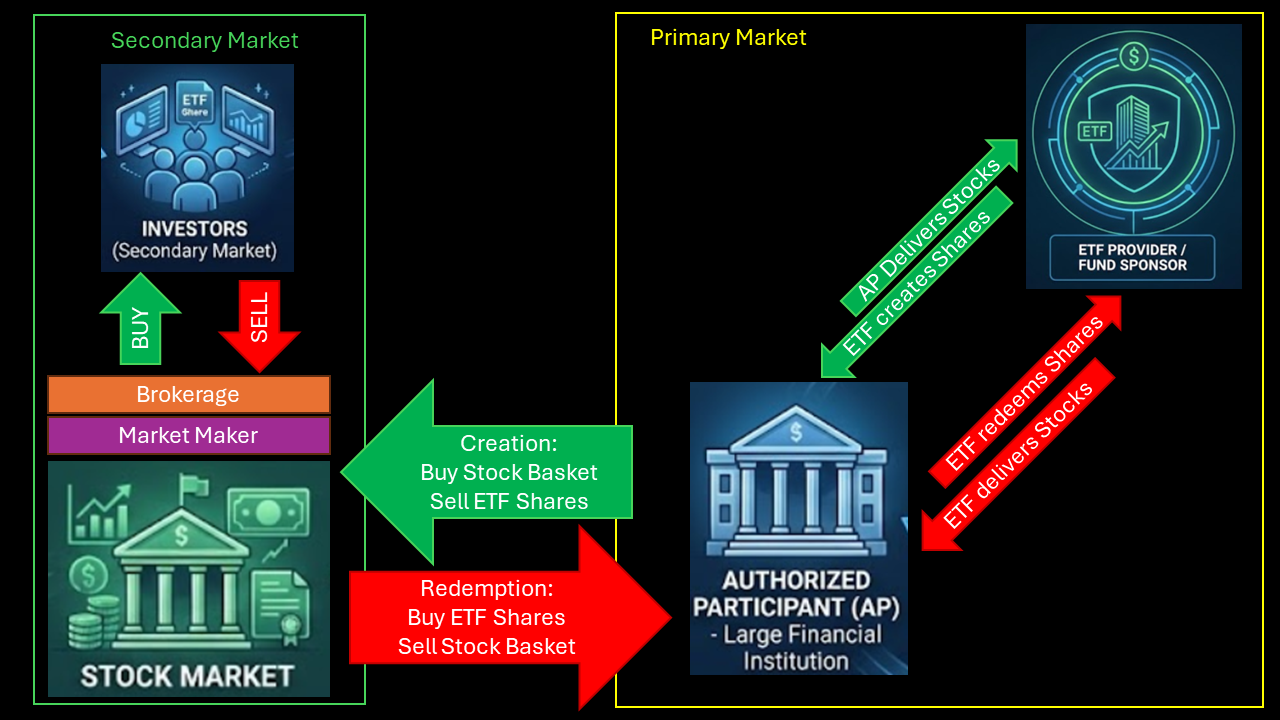
The creation–redemption process is the core mechanism that keeps an ETF's market price closely aligned with the actual value of its underlying assets (the net asset value, or NAV). Unlike shares of a company, the number of ETF shares is not fixed. Instead, it can expand or contract in response to investor demand, which helps prevent persistent overpricing or underpricing.
When demand for an ETF increases and its market price rises above the NAV, the creation process is triggered. Authorized participants observe this price discrepancy in real time during the trading day and typically decide within minutes whether an arbitrage opportunity is attractive. They assemble the underlying basket of securities that replicates the ETF's portfolio, a step that is usually completed intraday, often within a few hours, depending on market liquidity and the number of securities involved. Once the basket is delivered to the ETF issuer, new ETF shares are created. This creation step is operationally straightforward and is normally processed on the same trading day or by the next business day (T+0 or T+1). The newly created ETF shares can then be sold on the exchange almost immediately, increasing supply and pushing the market price back toward the NAV.
The redemption process follows a similar timeline in reverse. When selling pressure causes an ETF to trade below its NAV, authorized participants can identify the discount within minutes. They buy ETF shares on the exchange during the trading day and submit them for redemption. The redemption request is typically processed on the same day or the next business day, and the underlying basket of securities is delivered to the authorized participant shortly thereafter, again usually on a T+0 or T+1 basis. The redeemed ETF shares are cancelled, reducing the number of shares outstanding and helping the market price recover toward the NAV.
Overall, the full economic effect of creation or redemption—meaning the correction of price deviations—often happens very quickly, sometimes within minutes or hours, as markets anticipate the actions of authorized participants. From an operational and settlement perspective, the complete process from decision to final settlement usually takes one to two business days. This combination of fast market reaction and efficient settlement is a key reason why ETFs remain liquid and tightly priced even during periods of heavy trading or market stress.
Sources of Liquidity
There are actually two primary sources of ETF liquidity: the secondary market (or open market), consisting of shares bought and sold throughout the day, and the primary market managed by Authorized Participants. Most ETF investors rely on secondary market liquidity.
Primary market liquidity draws on the liquidity of the underlying securities comprising the ETF. Very large trades can tap into the deeper liquidity source of the primary market, where large blocks of ETF shares can be either created or redeemed.